money

The No. 1 Habit Destroying Retirement Dreams

Credit card debt can bury you in interest. However, there are tools to help you take control.

U.S. credit card balances have surged in the past several years, from $787 billion in Q2 2021 to $1.2 trillion in Q2 2025. Though the pace of increases has slowed in 2025, average credit card interest rates still hover around 25%, leading to balances that swell faster than many can pay them down.

Stack of credit cards lying on a black table.

Image source: Getty Images.

Debt can happen at any age

There’s never a good time to get caught up in high-interest debt, but the situation is particularly critical when that debt prevents you from investing for retirement. Regardless of your current age, the last thing you want to do is give up aspects of your retirement because you can’t afford them.

Due to soaring inflation, retirees outspend their annual incomes by more than $4,000, according to data from the Bureau of Labor Statistics. With limited options to bridge that financial gap, more are turning to credit cards to cover everyday expenses. In fact, 41% of households headed by someone between the ages of 65 and 74 carry credit card debt. Few of these households likely expected to depend on credit cards as they planned for retirement.

But it’s not just those who’ve reached retirement age who depend on credit cards. Experian offers this overview of average credit card debt by age:

Age

Average credit card balance

Generation Z

(born 1997-2012)

$3,493

Millennials

(born 1980-1996)

$6,961

Generation X

(born 1965-1979)

$9,600

Baby Boomer

(born 1946-1964)

$6,795

Silent Generation

(born 1928-1945)

$3,445

What credit card debt means to retirement

Let’s say you’re 55, part of Generation X, and owe $9,600 in credit card debt. If your cards carry an average annual percentage rate (APR) of 25% and you make monthly credit card payments totaling $300, it will take you 54 months to pay the cards off. Worse, you’ll spend $6,384 on interest.

Now, imagine that your credit card debt didn’t exist, and you invested that $6,384 instead. Assuming an average annual return of 7%, it would be worth $12,558 in 10 years, $17,614 in 15 years, and $24,704 in 20 years. That’s assuming you never contribute another penny to the investment. It may not be a fortune, but any money invested can be combined with Social Security and other sources of income to help you in retirement.

Whether you’re an experienced or beginner investor, freeing up the money currently spent on monthly credit card payments is one of the surest ways to bolster your retirement savings.

The trick is to get your credit card debt under control. Here are three ideas to get you started.

1. Look into a consolidation loan

Consider a personal loan with a lower interest rate than you’re paying on your credit cards (ideally, much lower). Use that loan to pay off your credit cards and then make regular monthly payments until the loan is paid off in full.

Again, let’s say you owe $9,600 in credit card debt. The personal loan you land has an APR of 11%. By making the same monthly payment of $300, the loan will be paid off in 39 months rather than the 54 months it would have taken to pay down the credit cards. Better yet, you’ll spend $1,815 in interest, saving you $4,569.

2. Take advantage of a pay-down option

Snowball and avalanche methods are two of the most popular ways to pay off existing debt. Here’s how they work:

  • Snowball method: Prioritize paying off your smallest debt first while continuing to make minimum payments on your other debts. Once the smallest debt is paid off, move to the next smallest balance, adding the money you were putting toward the first debt to pay down the second debt at a faster clip. Once the second smallest debt is paid off, move on to the third smallest, and so on. With each debt you pay off, you have more money available to pay toward the next one, creating a snowball effect.
  • Avalanche method: Prioritize paying off the debt with the highest interest rate (regardless of balance). Once the debt with the highest rate is paid off, move to the debt with the next highest interest rate, and so on. Like the snowball method, each debt you pay off gives you more money for the next debt.

3. Consider a debt management plan

Debt management plans (DMPs) consolidate your credit card debt into a single monthly payment. Typically offered through certified credit counseling agencies, DMP counselors work on your behalf to:

  • Help you determine how much you can afford to pay each month.
  • Negotiate with your creditors to adjust your repayment terms.
  • Accept your monthly payment and distribute it to your creditors.

While DMPs may be an effective way to climb out of debt, they can initially hurt your credit score, so be sure you understand the pros and cons before entering a DMP agreement.

Credit card debt is not insurmountable, but it does take effort to conquer. The sooner you do that, the sooner you can make progress toward your ideal retirement. Whether that’s fishing every day, visiting your grandkids, or retiring to a beach in a foreign country, it’s your dream to build.

Source link

1 Unstoppable Vanguard ETF to Buy With $630 During the S&P 500 Sell-Off

This broad-market index gives investors a taste of everything — even more than the S&P 500.

Even Warren Buffett, the greatest stock picker of all time, endorses low-cost, broad-market index funds and exchange-traded funds for most retail investors. This is because most investors don’t have the time to deeply research individual stocks, while broader-market indexes tend to win over time, with 8% to 10% long-term returns on average.

While large banks were the first to create index funds for their institutional clients, Vanguard was the first to offer diversified index funds to the public in 1976. Today, Vanguard is one of just a few major asset managers offering accessible, extremely low-cost index funds, costing investors just a handful of basis points in fees.

After the market’s strong recovery from April’s “Liberation Day” tariff fiasco, here’s the Vanguard fund I’d recommend today.

Buy the total market

Today, technology stocks, particularly around the AI buildout, have soared to very high valuations. Interestingly, some of the largest stocks in the world that have gone up the most, defying the law of large numbers, leaving large indexes like the Nasdaq-100 or even S&P 500 (^GSPC 0.53%) the most concentrated they’ve ever been in recent history.

Of course, there is a good reason why growth-oriented, large-cap technology stocks have soared over the past six months and even the last few years: artificial intelligence. The prospect of generative AI could very well lead to the next industrial revolution; meanwhile, only the largest, best-funded, most technically advanced companies likely have a chance to compete. Therefore, it’s no surprise the “Magnificent Seven” stocks only seem to be getting stronger.

That being said, valuation matters, and the widening gulf between the largest tech stocks and smaller stocks in other sectors is huge. Furthermore, once AI technology is honed and widely distributed, every business in every sector of the economy should be able to benefit from GenAI.

So while investors shouldn’t abandon AI tech stocks en masse, now would also be a good time to look at other types of stock in left-behind sectors. That makes this Vanguard ETF an excellent choice today.

Person smiling at his computer desktop.

Image source: Getty Images.

Vanguard Total Stock Market Index Fund

The Vanguard Total Stock Market Index Fund (VTI 0.51%) is my recommendation for index investors looking to put money to work today. As the name implies, this index tracks the entire stock market, including large-, mid-, small-, and even micro-cap stocks — the entire investing universe in the U.S.

Of course, a broad-market index will also have high weightings of the large-cap tech stocks discussed. Yet while investing in the total market index fund will still give investors some exposure to the AI revolution, those stocks will have a smaller weight than other index funds, such as the Vanguard S&P 500 ETF (VOO 0.60%). For instance, in the VTI, the largest stock in the market, Nvidia, has a 6.5% weighting, whereas Nvidia sports a 7.8% weighting in the VOO, which tracks the S&P 500, and a 9.9% weighting in the Invesco QQQ Trust (QQQ 0.73%), which tracks the Nasdaq-100.

Meanwhile, the total market fund will give a larger weight to smaller stocks in other cheaper sectors of the economy, which may outperform if there is a rebalancing and reversion to the mean. This is what happened in the early 2000s, when technology stocks crashed over the course of three years, but cheaper value stocks in other sectors of the market went on to outperform.

Currently, the VTI trades at a weighted average 27.2 times earnings, with a 1.14% dividend yield. It has risen 13.9% year to date, which is a strong performance, albeit behind that of the VOO and QQQ. Its expense ratio is 0.03%, which is so minuscule the fund is practically free.

Torn between momentum and value? Buy everything

The VTI is therefore a nice middle ground between those who are enthusiastic about the general prospects for AI technology, but are squeamish about tech stocks’ sky-high valuations relative to lower-priced sectors today. Therefore, it’s a great choice for investors looking to allocate money to stocks in October as part of their investment plan.

Billy Duberstein and/or his clients have no position in any of the stocks mentioned. The Motley Fool has positions in and recommends Nvidia, Vanguard S&P 500 ETF, and Vanguard Total Stock Market ETF. The Motley Fool has a disclosure policy.

Source link

Where Will Nvidia Be 24 Months After the Blackwell Launch? Here’s What History Says.

Nvidia stock has skyrocketed over the past few years amid excitement about the company’s AI dominance.

About a year ago, Nvidia (NVDA 0.86%) was facing one of its biggest moments ever. The artificial intelligence (AI) chip giant was launching its new Blackwell architecture, a system that was being met with “insane” demand as CEO Jensen Huang told CNBC at the time. The company announced Blackwell in March 2024 and the fourth quarter of the year was the first to include Blackwell revenue.

Blackwell was to be the first release of a new routine for Nvidia: launching chip or entire platform updates on an annual basis. Since that time, this new architecture has helped Nvidia’s earnings roar higher, with Blackwell data center revenue climbing 17% in the most recent quarter from the previous one. In the report, Huang said, “The AI race is on, and Blackwell is the platform at its center.” Meanwhile, Nvidia stock has reflected all of this, advancing 40% so far this year.

Now, it’s logical to wonder where Nvidia will be as this story progresses, for example, 24 months after the Blackwell launch. Here’s what history says.

Nvidia headquarters is shown.

Image source: Nvidia.

Nvidia’s path in AI

First, though, let’s consider Nvidia’s path in the AI market so far. The company has always been a graphics processing unit (GPU) powerhouse, but in its earlier days, it mainly sold these high-performance chips to the gaming market. As it became clear that their uses could be much broader, Nvidia developed the CUDA parallel computing platform to make that happen — and then, as the potential of AI emerged, Nvidia didn’t hesitate to put its focus on this exciting market.

That proved to be a fantastic move as it helped Nvidia secure the top spot in the AI chip market — and the quality and speed of its GPUs has kept it there. All of this has resulted in several quarters of double- and triple-digit revenue growth as well as high profitability on sales — gross margin has generally surpassed 70% in recent times.

To keep this leadership going, Nvidia committed to ongoing innovation, with the promise of updating its chips once a year. The company kicked this off with the launch of Blackwell about a year ago, then released update Blackwell Ultra a few months ago. Next up on the agenda is the Vera Rubin system, set for release late next year.

From platform to platform

All of these platforms operate together seamlessly, so customers don’t have to wait for a specific one and instead can get in on Nvidia’s current system and easily move forward with the latest innovations when needed. Still, as mentioned earlier, demand from big tech customers for the latest systems has been great — they want to win in the AI race and to do so aim to get their hands on the best tools as soon as possible.

So, where will Nvidia be 24 months after the Blackwell launch? The clues so far suggest revenue will continue to climb in the double-digits — and Wall Street’s average estimates call for a 33% increase in revenue next year from this year’s levels. And as Rubin is released, demand is likely to increase for that system as customers’ interest in gaining access to the latest AI technology continues.

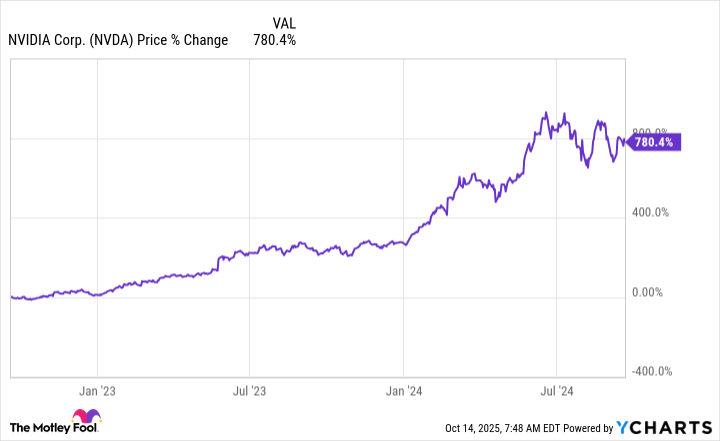
But what about Nvidia’s stock price? History offers some clues. Prior to this time, Nvidia’s major recent releases happened every two years. We can look back to the launch of the Ampere platform on May 14, 2020, and the release of Hopper on Sept. 20, 2022. And each time, over the next 24 months, Nvidia stock soared in the triple digits. It climbed 120% in the two years following the Ampere release and more than 700% following the release of Hopper.

NVDA Chart

NVDA data by YCharts

What history says

History shows Nvidia stock is on track for a triple-digit gain two years after the Blackwell launch. If we use the starting point as the first quarter of Blackwell revenue — this quarter ended on Jan. 26, 2025 — we can see the stock has climbed about 30% so far. But Nvidia still has plenty of time to post more Blackwell sales and potentially see its shares advance in the triple-digits from their level earlier this year through the first month of the 2027 calendar year.

To illustrate, a 100% gain from early 2025 levels would bring the stock price to $284, and that would result in $6.9 trillion in market cap by the start of 2027. This fits into a scenario I wrote about recently, predicting Nvidia will reach $10 trillion in market value by the end of the decade.

Of course, it’s impossible to guarantee this outcome — any negative geopolitical or economic news, or even an unexpected problem like a decline in tech spending could hurt Nvidia’s revenue and stock performance. But, if these potential risks don’t materialize, history could be right — and Nvidia stock may find itself significantly higher 24 months after the Blackwell launch.

Source link

Why I’m Not Opening Any CDs in 2025 — Even Though Rates Are Still Around 4%

If I were closer to retirement, it would be a different story.

In September, the Federal Reserve lowered its benchmark interest rate for the first time this year. And there’s a good chance we’ll see at least one more rate cut before 2025 comes to a close.

In light of this, you may be inclined to put some of your money into a CD before rates fall further. And if you’re near or in retirement, I’d say that’s probably a good idea.

A smiling young person at a laptop.

Image source: Getty Images.

But I’m not planning to open any CDs this year despite rates still being around 4%. Although that’s a good return given the risk profile, it’s not right for me because of where I am in my retirement savings journey.

The problem with CDs

At first, putting money into a CD might seem like a no-brainer. You can lock in a virtually risk-free return on your money in the ballpark of 4%, which might seem like a great deal if you’re someone who dreads stock market volatility.

The problem with CDs, though, is that they probably won’t pay you enough in the long run to outpace inflation. And you need your retirement savings to beat inflation so that by the time your career wraps up, you’ll have a large enough nest egg to live comfortably.

Imagine you’re able to get a 4% return on a $10,000 CD over the next 30 years (it’s unlikely since rates are still near a high, but this is just to illustrate a point). At the end of that savings window, you’d potentially be sitting on a little more than $32,400.

Meanwhile, let’s say you were to invest $10,000 in a portfolio of stocks or an S&P 500 index fund. There’s a good chance you’d score an 8% yearly return, since that’s a bit below the stock market’s average. In that case, after 30 years, you’d be looking at a little more than $100,600. That’s more than three times the total CDs would give you in this example.

And yes, this is just one example. The point, however, is that if you’re in the process of building wealth for retirement, CDs are generally not a good bet.

It makes sense to put money into CDs when you’re saving for a near-term goal and can’t risk losing money in the stock market. For example, if you’re aiming to buy a home in early 2027, go ahead and put your current down payment savings into a 12-month CD. It wouldn’t be safe to put that money into the stock market since you’ll be needing it pretty soon.

However, if you’re retiring in 20 or 30 years, then it doesn’t make sense to put your money into CDs. And it’s for this reason that I’m not opening CDs right now, either.

I’m not close to retirement age, so I still need my money to grow at a decent pace. To put it another way, a 4% return is not one I’d be happy about in my investment portfolio, which is why I’m sticking to my strategy of loading up on stocks and various ETFs.

CDs are great for near and current retirees

While it doesn’t make sense for me to put money into CDs right now, I have different advice if you’re someone who’s on the cusp of retirement or already retired. In that case, I’d say it could make sense to lock in a CD before rates fall.

It’s a smart idea for people who are close to or in retirement to have one to two years’ worth of living expenses in cash. That way, if the stock market slumps and the value of your investments drops, you won’t have to sell assets at a loss to get access to the money you need to pay your bills.

I would never recommend having all of your cash in CDs, but it’s not a bad idea to start a CD ladder. This means opening a series of CDs that come due at regular intervals — for example, every three to four months, or whatever cadence works best for you. That way, you can earn a guaranteed return on some of your money while also ensuring that it’s available to you at regular intervals.

All told, CDs have their purpose. But they’re not a good choice for me right now. And if you’re years away from retirement, they may not be right for you, either.

Source link

Is Lululemon Stock a Buy?

Lululemon (NASDAQ: LULU) was one of the fashion companies that crushed the market for over a decade. But shares have fallen from their high, and investors are wondering if the best is behind this yoga giant. In this video, we lay out why Lululemon’s comeback may be closer than you might think.

*Stock prices used were end-of-day prices of Oct. 10, 2025. The video was published on Oct. 17, 2025.

Where to invest $1,000 right now? Our analyst team just revealed what they believe are the 10 best stocks to buy right now. Continue »

Should you invest $1,000 in Lululemon Athletica Inc. right now?

Before you buy stock in Lululemon Athletica Inc., consider this:

The Motley Fool Stock Advisor analyst team just identified what they believe are the 10 best stocks for investors to buy now… and Lululemon Athletica Inc. wasn’t one of them. The 10 stocks that made the cut could produce monster returns in the coming years.

Consider when Netflix made this list on December 17, 2004… if you invested $1,000 at the time of our recommendation, you’d have $646,805!* Or when Nvidia made this list on April 15, 2005… if you invested $1,000 at the time of our recommendation, you’d have $1,123,113!*

Now, it’s worth noting Stock Advisor’s total average return is 1,055% — a market-crushing outperformance compared to 188% for the S&P 500. Don’t miss out on the latest top 10 list, available when you join Stock Advisor.

See the 10 stocks »

*Stock Advisor returns as of October 13, 2025

Travis Hoium has no position in any of the stocks mentioned. The Motley Fool has positions in and recommends Lululemon Athletica Inc. The Motley Fool has a disclosure policy.

Source link

The Real Difference Between a 680 and a 740 Credit Score (and What It’ll Cost You)

Most people know that a higher credit score is better — but how much better? What does it really cost to fall just one tier below?

The average credit score in 2025 is 715, according to Motley Fool Money research. Yours might be above that, or below. And while a few points here or there may not change how lenders treat you, once the gap widens, the financial impact gets real. Especially when you’re moving between major credit tiers.

For example, a credit score of 680 sits at the lower end of the “good” range, while 740 breaks into “very good” territory. Both of these scores aren’t too far from the national average, but they unlock very different rates, terms, and perks.

1. Mortgage rates: A small score gap can cost tens of thousands

Let’s start with the biggest loan most people ever take on: a mortgage.

Suppose you’re applying for a $400,000, 30-year fixed mortgage. Here’s how your credit score might affect the interest rate you’re offered:

Credit Score

APR

Est. Monthly Payment

Total Interest Over 30 Years

680

7.00%

$2,661

$558,036

740

6.25%

$2,463

$486,633

Data source: Author’s calculations.

Total difference: over $71,000

To be fair, a lot can change over a 30-year mortgage. If your credit score improves down the road, you may be able to refinance into a lower rate and save money over time. But this example shows just how much a lower score can impact your finances right now — especially if you’re locking in a loan with today’s rates. Even a small bump in your score before applying could lead to serious savings.

2. Auto loans: Higher monthly payments, even on smaller balances

Auto lenders are also score-sensitive. According to MyFICO, here’s the rate difference you could expect with different credit scores, based on a 60-month new car loan:

  • 680 score (prime): ~9.963%
  • 740 score (prime): ~6.695%

On a $35,000 car loan, that difference could cost you an extra $55 per month, and over $3,300 extra in interest over the life of the loan.

Even though both of these scores fall into the “prime” range for FICO® Scores, there’s quite a big difference in the rates that are offered.

3. Insurance premiums: A hidden cost many don’t realize

In many states, your credit score plays a role in how much you pay for car and home insurance. It doesn’t show up as an interest rate — just a higher premium.

According to Motley Fool Money research, drivers with poor credit often pay more than double what those with excellent credit are charged. Even a modest difference, like $50 more per month, can add up to over $6,000 in extra premiums over a decade.

Got good credit? You may qualify for better rates. See our top insurance carriers for people with strong credit scores.

4. Credit cards: Missed rewards and higher APRs

Most of the best credit cards (including travel cards, 0% intro APR cards, and big cash back cards) prefer applicants with higher credit scores.

That doesn’t mean you’ll be approved or denied strictly on your score (I’ve been denied for some cards even with an 800+ score). But when your score is lower your approval odds typically drop.

That also means missing out on premium rewards rates, long 0% intro APRs, or welcome bonuses worth $750 or more. These can be incredibly valuable perks. But you need the credit score to unlock them.

Raising your score is worth it

Here’s the bright side: moving from a 680 to a 740 (or higher) isn’t some impossible leap.

Many people can see a 40- to 60-point boost within a year or two by practicing good credit habits. Here are a few that make a huge difference:

  • Paying down credit card balances (lowering your utilization)
  • Setting autopay to never miss a due date
  • Not opening or closing too many accounts at once (and keeping your oldest cards open to improve history length)
  • Asking for a credit limit increases on existing cards slowly over time

By far the biggest factor is making sure your bills are paid on time, every time.

Even small tweaks can have a big payoff. The difference between “good” and “very good” credit could be tens of thousands of dollars over your lifetime.

Want to put your credit score to work? Check out our favorite credit cards for good-to-excellent credit — including top rewards cards and 0% intro APR offers.

Source link

BYD Stock Is Down Significantly — Is This Electric Vehicle Giant Still Worth Holding?

BYD shares trade at a big discount to Tesla.

BYD (BYDDY -1.09%) produces far more vehicles than Tesla. But you wouldn’t be able to tell based on stock prices alone. The Chinese electric vehicle maker’s market cap is around $990 billion, while U.S.-based Tesla is valued at more than $1.3 trillion.

Part of the valuation gap is explained by BYD’s recent struggles. Shares are down 20% in value since May. Tesla stock, meanwhile, has gained more than 40% in value over that time period. Is this your chance to buy BYD at a rare discount?

There’s no doubt that shares look compelling. But there are two critical factors to consider before jumping in.

1. Warren Buffett changed his mind about BYD

Legendary investor Warren Buffett was one of the first major investors in BYD. He first acquired shares 17 years ago, paying $230 million for a 10% stake in the business. It wasn’t actually Buffett that spotted the opportunity, but rather his longtime business partner, Charlie Munger.

Earlier in its history, BYD was focused on battery technology. Through vertical integration and affordable labor in China, the company was able to keep costs low, leading to major customer wins. It launched its first vehicles in 2003, gradually expanding its portfolio to include two of the most popular EVs in the world. This year, analysts expect the company to produce more EVs than Tesla, making it the number one EV maker worldwide.

Over the last 17 years, Buffett has made more than 2,000% on his original investment. This year, however, he liquidated his entire position. Why? Even though it has massive scale, BYD is still primarily a Chinese company. Around 80% of its sales are domestic, a reality that creates two critical headwinds.

First, the Chinese economy has been gradually slowing. Last year, GDP in the country grew by just 5% — one of the lowest figures in decades. Accordingly, BYD’s domestic sales have struggled in 2025, leading to a sales forecast cut by management.

Second, the Chinese government has a heavy influence on BYD. The company has received significant financial support from the government over the years. But that generosity may be ending. BYD failed an audit this summer, which may force it to repay more than $50 million in subsidies. The Chinese government’s involvement in the auto industry has ramped up this year, with the ultimate results still uncertain.

Buffett hasn’t yet commented on his stake sale. But with rising political uncertainty and a shaky domestic market, it appears as if the Oracle of Omaha has had enough with this long-term position.

Map of China.

Image source: Getty Images.

2. Don’t compare BYD to Tesla

Due to China’s sluggish GDP and falling population growth, it will be difficult for BYD’s sales to maintain historical growth rates over the long term without expanding international sales aggressively. Increasing regulatory oversight may complicate efforts to do so, but BYD is making moves to shift its focus away from China.

A recent deal with Uber Technologies, for instance, attempts to make its vehicles more accessible to drivers in Europe and Latin America. The deal also paves the way for BYD to help power Uber’s robotaxi division in certain parts of the world.

On the surface, now looks like a compelling time to pick up BYD shares. While challenges exist, the company has an impressive manufacturing base, with the ability to sell cars at a price point that few competitors can match at scale. Its recent Uber deal, meanwhile, gives it exposure to the robotaxi market, which could eventually be worth more than $5 trillion globally.

Add in that shares trade at roughly 1 times sales versus Tesla’s valuation of nearly 17 times sales, and it’s not hard to get excited. Here’s the problem: BYD isn’t Tesla. Tesla, for instance, has a leading position in the robotaxi market, making it far more than a simple auto manufacturer. BYD’s position in the market is simply as a supplier to operators like Uber.

Is BYD stock a buy today? Patient investors comfortable with Chinese regulatory uncertainty may think so. But the valuation gap between BYD and Tesla shouldn’t be a motivating factor. These are two very different businesses.

Ryan Vanzo has no position in any of the stocks mentioned. The Motley Fool has positions in and recommends Tesla and Uber Technologies. The Motley Fool recommends BYD Company. The Motley Fool has a disclosure policy.

Source link

Should You Buy ASML Stock Now in October?

ASML (NASDAQ: ASML) provided a huge investor update that reiterated confidence in its longer-term prospects.

Where to invest $1,000 right now? Our analyst team just revealed what they believe are the 10 best stocks to buy right now. Continue »

*Stock prices used were the afternoon prices of Oct. 14, 2025. The video was published on Oct. 16, 2025.

Should you invest $1,000 in ASML right now?

Before you buy stock in ASML, consider this:

The Motley Fool Stock Advisor analyst team just identified what they believe are the 10 best stocks for investors to buy now… and ASML wasn’t one of them. The 10 stocks that made the cut could produce monster returns in the coming years.

Consider when Netflix made this list on December 17, 2004… if you invested $1,000 at the time of our recommendation, you’d have $638,300!* Or when Nvidia made this list on April 15, 2005… if you invested $1,000 at the time of our recommendation, you’d have $1,114,470!*

Now, it’s worth noting Stock Advisor’s total average return is 1,044% — a market-crushing outperformance compared to 188% for the S&P 500. Don’t miss out on the latest top 10 list, available when you join Stock Advisor.

See the 10 stocks »

*Stock Advisor returns as of October 13, 2025

Parkev Tatevosian, CFA has positions in Nvidia. The Motley Fool has positions in and recommends ASML, Nvidia, and Taiwan Semiconductor Manufacturing. The Motley Fool has a disclosure policyParkev Tatevosian is an affiliate of The Motley Fool and may be compensated for promoting its services. If you choose to subscribe through his link, he will earn some extra money that supports his channel. His opinions remain his own and are unaffected by The Motley Fool.

Source link

Better Artificial Intelligence (AI) Stock: Palantir vs. Nvidia

These two companies represent different sides of the AI investment trend.

The artificial intelligence (AI) megatrend has dominated the stock market over the past three years, and with massive AI spending projections stretching out through 2030 and beyond, that doesn’t look likely to change anytime soon. Two of the most successful stock picks in that part of the tech sector in recent years have been Palantir (PLTR 0.11%) and Nvidia (NVDA 0.86%). They aren’t competitors, as they operate on different sides of the AI value chain. Nvidia is a largely hardware provider, while Palantir makes software.

Both have made their long-term investors a ton of money, but the question is, which one provides the better investment opportunity from here? Let’s break that question down and consider it by category.  

Business model

Nvidia makes the world’s leading graphics processing units (GPUs), and its wares are by far the most popular parallel-processor chips for powering and training AI models. Nvidia has enjoyed solid market dominance over the past few years, but rising competition from AMD (NASDAQ: AMD) and Broadcom (NASDAQ: AVGO) could challenge that. Additionally, the AI infrastructure buildout won’t last forever. There will eventually be a time when companies aren’t racing to add high volumes of computing capacity, but instead mostly replacing processors as they reach the end of their useful lifespans.

Palantir sells its customers artificial intelligence-powered data analytics platforms, and it has a large client base in both the commercial and government spaces. Palantir’s software enables those with decision-making authority to act quickly and with the most up-to-date information possible. Furthermore, it also offers automation tools that can task AI agents with jobs that humans have traditionally done, freeing up employees to do work that requires original thinking.

Even after the initial stages of the AI revolution are over, the use cases for AI will continue to grow. Palantir’s software is also a subscription service, so for customers to continue using it, they must pay their Palantir bills every year, while data center operators may be able to put off replacing their Nvidia GPUs for a while. This makes Palantir’s business model more sustainable, giving it the edge here.

Winner: Palantir

Growth rates

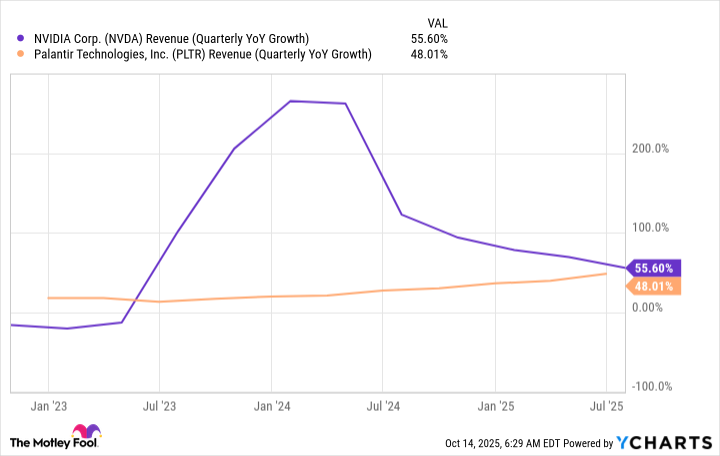
Both companies are growing at similar rates, although Nvidia’s sales have decelerated on a percentage basis, while Palantir’s continue to gradually accelerate.

NVDA Revenue (Quarterly YoY Growth) Chart

NVDA Revenue (Quarterly YoY Growth) data by YCharts.

Whether Palantir will take the lead on growth or not, only time will tell, but with massive demand for AI services still out there, each will likely maintain a relatively rapid growth rate for the foreseeable future, leading me to view them as fairly evenly matched by this criterion.

Winner: Tie

Valuation

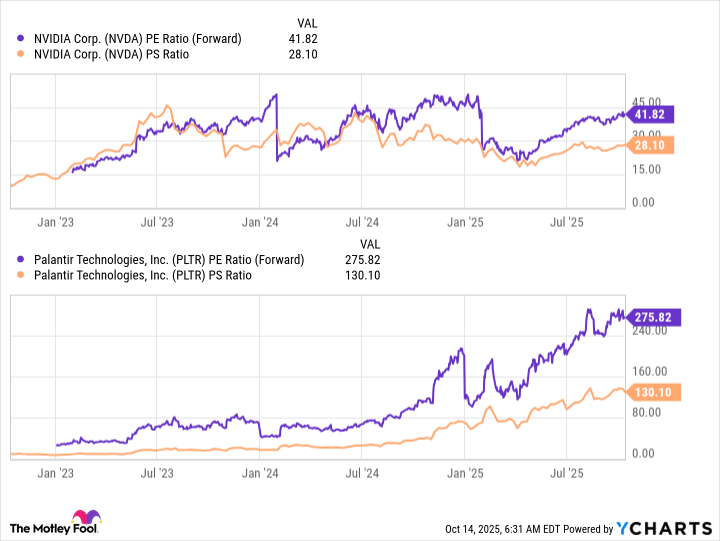
From a valuation standpoint, the comparison isn’t particularly close. Palantir’s stock has delivered incredible returns alongside Nvidia, but a large chunk of Palantir’s share price gains has come from its valuations rising to outsized levels, and that condition is not sustainable.

NVDA PE Ratio (Forward) Chart

NVDA PE Ratio (Forward) data by YCharts.

Nvidia trades at a comparatively cheap 42 times forward expected earnings, while Palantir’s ratio tops 275. For comparison, if Nvidia had the same forward P/E as Palantir, it would be worth over $30 trillion, versus the $4.6 trillion it’s actually worth.

This shows that Palantir is overvalued. It will have to deliver years of sales and earnings growth to return the stock to a more reasonable level, even if it simply moves sideways from here. If we set Nvidia’s current valuation of 42 times forward earnings as that “more reasonable” level, and Palantir’s revenue rises at a 50% compound annual growth rate while it maintains a 35% profit margin, it would take over five years’ worth of growth to bring its P/E down to the target. And again, that assumes the stock doesn’t rise during those five years.

That means that Nvidia has basically a five-year head start on Palantir’s long-term stock performance. Given that AI spending is projected to grow rapidly over the next five years, Nvidia shares should easily outperform Palantir moving forward, as Palantir will spend most of the next five years growing into its already expensive valuation. Which is why, despite the two companies’ similar growth rates and Palantir’s more attractive business model, it’s not the AI stock I’d suggest buying now.

Overall winner: Nvidia

Keithen Drury has positions in Broadcom and Nvidia. The Motley Fool has positions in and recommends Advanced Micro Devices, Nvidia, and Palantir Technologies. The Motley Fool recommends Broadcom. The Motley Fool has a disclosure policy.

Source link

2 Big Changes to Your Income Taxes Coming in the 2026 Tax Filing Year

The new rules will probably affect your finances.

In the U.S., virtually all of the income you earn is subject to federal income tax. There are specific rules you need to follow regarding how much you pay, as well as the deductions that you are allowed to claim.

The IRS recently announced some changes to the tax rules for 2026, and those changes could affect how much you end up paying. Since these changes are for the 2026 tax year, they will be in effect for income you earn starting in January of 2026 and will affect the tax return that you file in April of 2027.

Here’s what you need to know about two of the big changes that will impact your finances in the 2026 tax filing year.

1. Tax brackets are changing

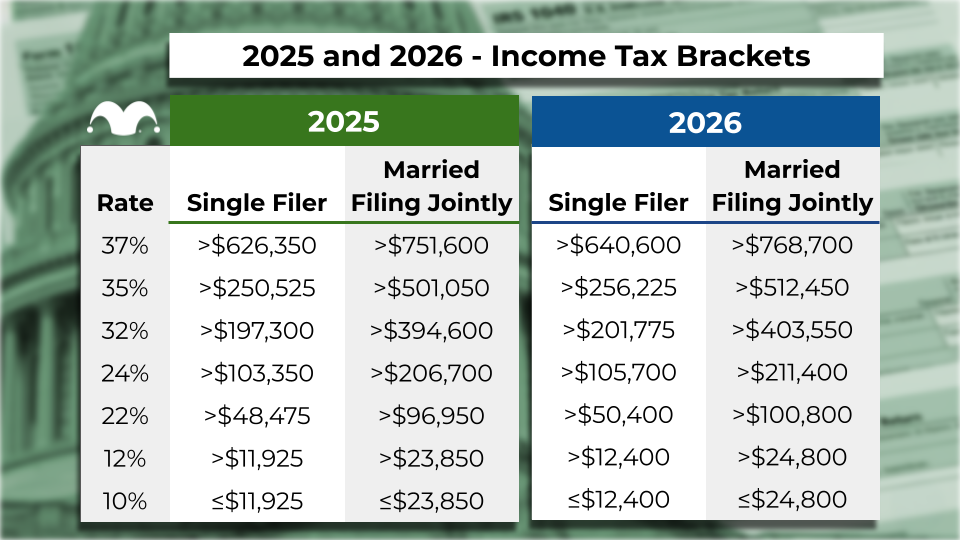
The first change that is taking place relates to the tax brackets. As the tables below show, the income ranges within each tax bracket are changing.

Tables showing the income tax brackets for 2025 and 2026.

Tax brackets exist in the U.S. because we have a progressive income tax system. You do not pay the same tax rate on all of the income that you earn. Tax brackets set the rates that you will pay at different income ranges.

For example, everyone — no matter how much they earn — pays 10% on the first $11,925 in earnings they have in 2025. And in 2026, everyone will have a little more of their income taxed at that ultra-low tax rate since they won’t move up to the 12% bracket unless they have earned more than $12,400.

With these changes to the tax brackets, the taxes that most people pay should decline because they can now earn more income before moving up to the next tax bracket and paying a higher rate.

2. The standard deduction is changing

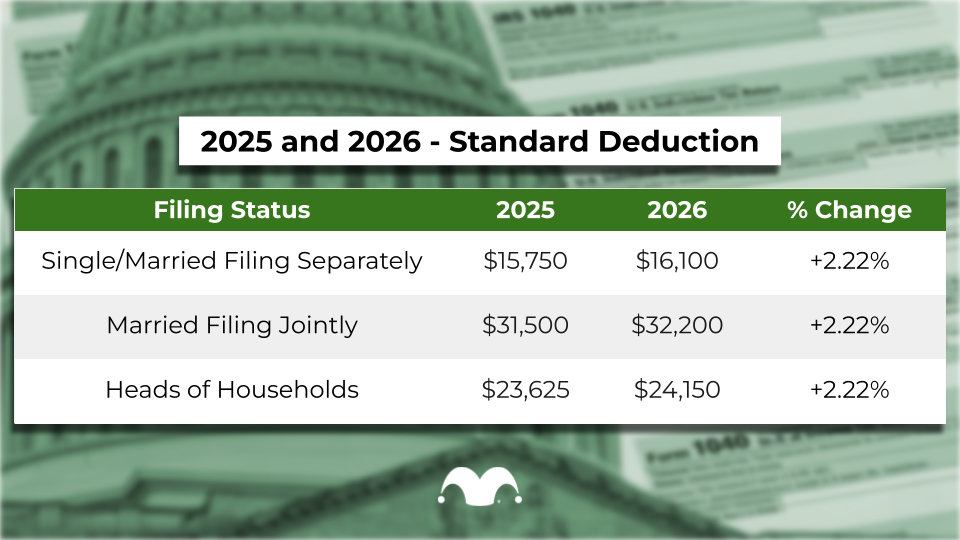
There’s another big change coming for the 2026 tax filing year. As the table below shows, this change is to the standard deduction.

Table showing the standard deduction for 2025 and 2026.

Image source: The Motley Fool.

The majority of tax filers claim the standard deduction, which means they can subtract this set amount from their taxable income when determining how much they owe.

For example, if you make $45,000 a year, you are not taxed on $45,000. You can subtract the amount of the standard deduction from this amount. If you are a single filer or married filing separately, this would mean you could subtract $15,750 in 2025 and $16,100 in 2026. So, you would be taxed on $29,250 in income in the 2025 tax year and on $28,900 in 2026.

Not everyone claims the standard deduction because some people opt to itemize deductions on their return. Itemizing means claiming deductions for specific things like mortgage interest and charitable contributions.

It only makes sense to itemize if the value of your itemized deductions adds up to more than the standard deduction — which is not the case for most people. And, as the standard deduction increases, itemizing makes sense for fewer and fewer people.

How will these changes affect your taxes in 2026?

With a higher standard deduction and income thresholds to move into higher tax brackets increasing, your tax bill should go down in 2026.

You will pay tax on less income due to being able to deduct 2.22% more money, and more of your income will be taxed at lower rates since it takes more income to move up to a higher bracket.

This makes sense, since tax brackets increase each year because of inflation. Each dollar you earn buys less every year as prices rise, so if the tax brackets never changed, taxpayers would be pushed into higher brackets without a real increase in earning power.

Other tax changes will take effect in 2026, thanks to the Big Beautiful Bill, including an added deduction for seniors. All of this means that many people should expect their federal income tax bill to look very different for the 2026 tax year.

Source link

Why This California-Based Company Could Reward Patient Investors

This company pays a 5.4% yield that is growing consistently.

This is an uncertain world and there are very few sure things. As Ben Franklin once observed, “nothing is certain except death and taxes.” But I think investors can almost add a third thing to that item — the trusty real estate dividend stock Realty Income (O 1.10%) and its ability to keep paying investors, no matter what the market looks like.

Realty Income is perhaps the most reliable dividend stock you can find. And it’s a well-deserved mantle. Realty Income just declared its 664th consecutive monthly dividend since the company was founded in 1969 — a streak that goes back more than 55 years. The company has also increased its dividend 132 times in that period, giving Realty Income shareholders a rare blend of growth and income.

This California-based real estate investment trust (REIT), is a no-brainer dividend stock to buy, and is a perfect investment for anyone looking to build their dividend portfolio over a long period of time.

About Realty Income

Realty Income is based in California, but it has a massive presence. The company has 15,600 commercial properties, located in every U.S. state and much of Europe. Realty Income’s customers represent 91 separate industries and include more than 1,600 clients.

And most importantly, the company’s portfolio has an occupancy rate of 98.5% — meaning that Realty Income is assured of a consistent revenue stream. That’s how it can afford to pay a consistent, reliable monthly dividend. Industries the company leases property to include grocery stores, convenience stores, home improvement stores, dollar stores, restaurants, drug stores, health and fitness centers, and more.

The company also diversifies its portfolio, which means a catastrophic failure in an industry or by a single business won’t hurt its operations. Convenience store chain 7-Eleven is the biggest tenant  for Realty Income, and even then it’s only a 3.4% weighting.

Top 10 Clients

Portfolio Weighting

7-Eleven

3.4%

Dollar General

3.2%

Walgreens

3.2%

Dollar Tree

2.9%

Life Time Fitness

2.1%

EG Group Limited

2.1%

Wynn Resorts

2%

B&Q

2%

FedEx

1.8%

Asda

1.6%

Data source: Realty Income. Data as of June 30, 2025. 

Realty Income stock performance

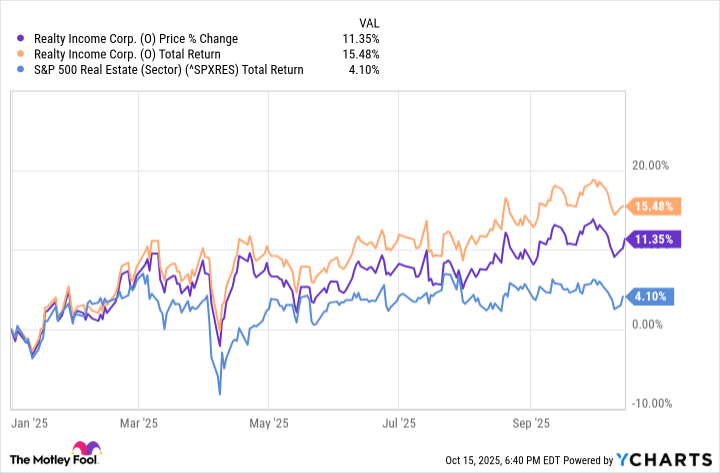
Unsurprisingly, real estate stocks haven’t done well for much of the year. The S&P 500 real estate sector as a whole is up only 4%, thanks to the weak housing market and high interest rates that make borrowing more expensive. But Realty Income has been able to shake off those pressures. The stock is up 11% on the year, and when you calculate the total return of reinvesting dividend payments, the return is more than 15%.

O Chart

O data by YCharts

The company recorded $1.41 billion in revenue in the second quarter, up from $1.34 billion a year ago. Income was down, however, thanks to borrowing costs — the company recorded $196.9 million and $0.22 per share versus $256.8 million and $0.29 per share a year ago.

Realty Income lowered its full-year guidance, with net income now expected to be $1.29 to $1.33 per share, from previous guidance of $1.40 to $1.46 per share.

Shopper in a convenience store.

Image source: Getty Images.

The case for Realty Income

There’s nothing flashy about this stock. But that’s fine — not everything in your portfolio needs to be a shiny new toy. Realty Income’s strength comes with its consistency and long-term growth window.

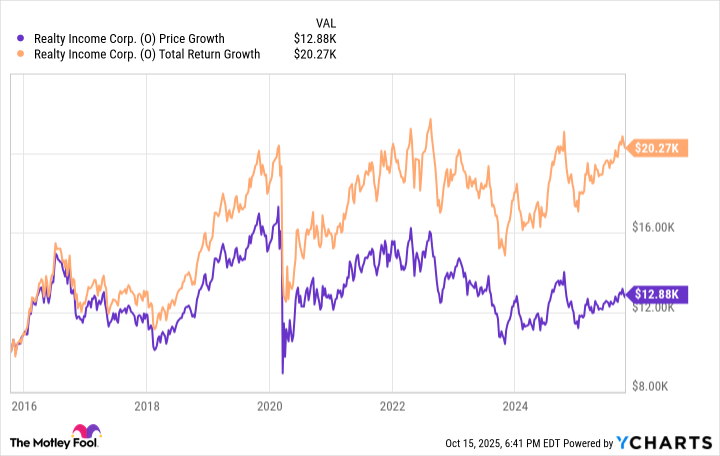
An investment 10 years ago in Realty Income would give you $20,270 today, assuming that you reinvested all those dividends back into your stock. Had you pocketed the money, you’d still have $12,880 — which all goes to show the power of compound interest.

O Chart

O data by YCharts

And remember, because Realty Income is a REIT, it’s required by law to disburse 90% of its profits back to shareholders (the current yield is 5.4%). Because it’s a monthly payout instead of a quarterly check, investors get the proceeds quicker, and those funds can work for them rather than working for Realty Income.

If you are an income investor, you really can’t beat Realty Income for its business plan, diversification, and combination of growth and income. If you are a patient investor with a long-term view, Realty Income is a perfect dividend stock.

Patrick Sanders has no position in any of the stocks mentioned. The Motley Fool has positions in and recommends Realty Income. The Motley Fool recommends FedEx. The Motley Fool has a disclosure policy.

Source link

3 High-Yield Dividend Stocks to Buy With $1,000 and Hold Forever

If you are looking for reliable income in today’s lofty market, this trio should provide you with the sustainable yields you seek.

The S&P 500 index (^GSPC 0.53%) has a miserly yield of just 1.2% or so today. That’s a number that you can beat pretty easily, but you want to make sure you do it with reliable dividend stocks. There are some companies that have huge yields, but the risk involved isn’t worth it.

That’s why you’ll probably prefer to buy (and likely hold forever) companies like Realty Income (O 1.13%), Prologis (PLD 2.40%), and UDR (UDR 0.50%). Here’s a quick look at each of these high-yield dividend stocks.

1. Realty Income is boring, which is a good thing

Realty Income is the largest net lease real estate investment trust (REIT) you can buy. It owns over 15,600 properties and has a market cap that is more than three times larger than its next-closest peer. Add in a dividend yield of 5.4% and a 30-year streak of annual dividend increases and you can see why dividend investors would like this stock.

The key, however, is how boring a business it is. It starts with the net lease approach. A net lease requires the tenant to pay for most property-level expenses. That saves Realty Income cost and hassle, leaving it to, in a simplification of the situation, sit back and just collect rent. On top of that, the company’s primary focus is retail properties, which are fairly easy to buy, sell, and release if needed. But that isn’t the end of the story, either, since Realty Income is also geographically diversified, with a growing presence in Europe.

Slow and steady is the name of the game for Realty Income, which makes sense given that the REIT has trademarked the nickname “The Monthly Dividend Company.” This high yielder isn’t going to excite you, but that’s basically the point. Investing $1,000 into Realty Income will leave you owning roughly 16 shares.

2. Prologis is building from within

Prologis is another industry giant, this time focused on the industrial asset class. It is one of the largest REITs in the world, with a market cap of more than $100 billion. (It’s about twice the size of Realty Income, which has a roughly $50 billion market cap.) The dividend yield is around 3.5%, which isn’t nearly as nice as what you’d get from Realty Income, but there’s more growth opportunity. To put a number on that, Realty Income’s dividend has grown 45% or so over the past decade while Prologis’ dividend has increased by over 150%.

Like Realty Income, Prologis offers global diversification. It has operations in North America, South America, Europe, and Asia, with assets in most prominent global transportation hubs. It has increased its dividend annually for 12 years, with a high likelihood of years of dividend growth ahead. That’s because the REIT has a $41.5 billion opportunity to build new properties on land it already owns. What’s exciting now is that the dividend yield happens to be near the high end of the range over the past decade, suggesting today is a good time to jump aboard. A $1,000 investment will allow you to buy eight shares of the stock.

3. UDR is diversified and provides a basic necessity

UDR is an apartment landlord, offering the basic necessity of shelter. That’s not going to go out of style anytime soon. The company underwent a painful overhaul a few years back when it sold a portfolio of lower quality apartments, leaving it focused on its remaining and better-positioned assets. This was a good move for the REIT, but it led to a dividend reset (the painful part for shareholders). However, the dividend has been growing ever since, with an annual streak that’s now up to 16 years. There’s no reason to believe another cut is in the cards.

What dividend lovers get now, however, is fairly attractive. For starters, the portfolio is well-diversified by geographic region in the United States and by quality (A and B level assets only, the fixer-uppers it once owned are gone). Technology has been an increasingly important aspect of the business, with UDR working to use the internet to lease and serve tenants more nimbly. Essentially, UDR is a great way to get diverse exposure to apartments.

UDR’s dividend yield is 4.7% right now, which is fairly high for the REIT and well above the REIT average of around 3.8%. If you want to own a REIT that provides a basic necessity, UDR is worth looking at today. A $1,000 investment will get you roughly 27 shares.

Three high-yield, buy-and-hold options for your portfolio

If you are focused on yield, Realty Income is likely to be the most appropriate choice for your portfolio. If you like dividend growth, take a look at Prologis. And if you are fond of companies that provide basic services that everyone needs, that would be UDR. All three have lofty yields and are worth buying and holding for the long term.

Reuben Gregg Brewer has positions in Realty Income. The Motley Fool has positions in and recommends Prologis and Realty Income. The Motley Fool recommends the following options: long January 2026 $90 calls on Prologis. The Motley Fool has a disclosure policy.

Source link

Nixon Peabody Dumps 25,000 Shares of General Dynamics (GD) for $8.1 Million

On October 17, 2025, Nixon Peabody Trust Company disclosed in an SEC filing that it sold 25,734 shares of General Dynamics (GD 0.22%), an estimated $8.11 million trade.

What happened

According to a filing with the Securities and Exchange Commission dated October 17, 2025, Nixon Peabody Trust Company reduced its stake in General Dynamics by 25,734 shares during Q3 2025. The estimated transaction value, based on the quarter’s average price, was $8.11 million. The fund now reports holding 30,224 shares in General Dynamics, worth $10.31 million.

What else to know

This reduction brings the stake in General Dynamics to 0.75% of Nixon Peabody Trust Company’s 13F assets, as of Q3 2025. Previously, the position made up 1.26% of the fund’s AUM, as of Q2 2025.

Top five holdings after the filing:

  • IDEV: $88.54 million (6.48% of AUM) as of September 30, 2025
  • MSFT: $81.41 million (5.96% of AUM) as of September 30, 2025
  • AVLV: $71.50 million (5.24% of AUM) as of September 30, 2025
  • AAPL: $67.89 million (4.97% of AUM) as of September 30, 2025
  • NVDA: $65.25 million (4.78% of AUM) as of September 30, 2025

As of October 17, 2025, shares of General Dynamics were priced at $331.15, up 7.4% for the year through October 17, 2025 and underperforming the S&P 500 by 3.2 percentage points over the same period.

Company Overview

Metric Value
Market Capitalization $89.08 billion
Revenue (TTM) $50.27 billion
Net Income (TTM) $4.09 billion
Price (as of market close October 17, 2025) $331.15

Company Snapshot

General Dynamics offers business jets, naval vessels, combat vehicles, weapons systems, and advanced IT solutions through four segments: Aerospace, Marine Systems, Combat Systems, and Technologies.

The company generates revenue primarily through manufacturing and servicing defense platforms, business aviation, and technology solutions for government and commercial clients.

It serves U.S. and allied government agencies, defense departments, and commercial aviation customers worldwide.

General Dynamics is a leading global aerospace and defense contractor with a diversified portfolio spanning business aviation, shipbuilding, land combat systems, and defense technology.

Foolish take

Nixon Peabody Trust Company scaled back its position in General Dynamics, but even before the sell, this stock accounted for only a small fraction of the fund’s overall portfolio at just 1.26% of AUM — well outside its top five holdings.

It’s worth noting that although General Dynamics has lagged behind the S&P 500, it’s up by more than 25% year to date and 133% over the last five years, as of October 17, 2025. With the timing of this sell-off, it’s not surprising that institutional investors are cashing in on those earnings.

General Dynamics remains a major name in the defense sector, recently securing a $1.5 billion contract with U.S. Strategic Command to modernize its enterprise IT systems.

The company also has a long history of dividend growth, increasing its dividend payout for 28 consecutive years. Defense companies like General Dynamics can already offer some stability and predictability for investors thanks to contracts with the U.S. government, while consistent dividends can be appealing to income investors, too.

Glossary

13F: A quarterly SEC filing by institutional investment managers disclosing their equity holdings.
Assets Under Management (AUM): The total market value of investments managed on behalf of clients by a fund or institution.
Quarter (Q3 2025): The third three-month period of a financial year; here, July–September 2025.
Position: The amount of a particular security or asset held by an investor or fund.
Top five holdings: The five largest investments in a fund’s portfolio by value.
Stake: The ownership interest or share an investor holds in a company.
Defense contractor: A company that provides products or services to military or government defense agencies.
Segment: A distinct business division within a company, often reporting separate financial results.
TTM: The 12-month period ending with the most recent quarterly report.

Katie Brockman has no position in any of the stocks mentioned. The Motley Fool has positions in and recommends Apple, Microsoft, and Nvidia. The Motley Fool recommends the following options: long January 2026 $395 calls on Microsoft and short January 2026 $405 calls on Microsoft. The Motley Fool has a disclosure policy.

Source link

Where Will Nvidia Stock Be in 2 Years?

Nvidia’s stock still has strong upside from here.

Nvidia (NVDA 0.86%) has grown to become the largest company in the world, but the question on many investors’ minds is if the company has more upside ahead in the coming years. The answer looks to be yes.

Powering the AI infrastructure ecosystem

Nvidia is much more than just a chipmaker that makes graphics processing units (GPUs). It is the company whose ecosystem is most responsible for powering the current artificial intelligence (AI) revolution that is taking place.

Nvidia’s biggest advantage starts with its CUDA software platform, which it developed to allow its chips to be easily programmable for tasks outside their original purpose of speeding up graphics rendering in video games. While it took time for other markets to develop, the company smartly gave CUDA away for free to universities and research labs that were doing early work on AI.

This led to nearly all foundational AI code being written on its software and optimized for its chips. Since rewriting code and retraining developers for another platform would be both costly and time-consuming, this has created a huge moat for the company. This can be seen both in the company’s market share and growth. Last quarter, it held a more than 90% market share in the GPU space, while its data center revenue climbed to $41.1 billion, up from just $10.3 billion two years ago.

Nvidia’s moat does not end with CUDA, though. It developed its NVLink interconnect to allow its GPUs to act as a single unit. That keeps customers from mixing in AI chips from other vendors in an AI cluster. Meanwhile, its 2020 purchase of Mellanox gave it a networking component that allows it to provide end-to-end AI factories. Last quarter, its data networking revenue nearly doubled to $7.3 billion, showing how important this has become to the company.

The company is not stopping there. Its up to $100 billion investment in OpenAI gives it a stake in one of the companies at the forefront of AI models and helps give one of its largest customers financing to buy or rent its chips. While OpenAI has struck deals with other chip companies, no one else is getting an equity stake in the ChatGPT maker.

AI infrastructure spending, meanwhile, is showing no signs of slowing. Nvidia estimates that the total addressable market for AI hardware and systems could climb from roughly $600 billion today to as much as $4 trillion in the next several years. Nvidia is bound to get more than its fair share of this spending directed its way.

Artist rendering of an AI chip.

Image source: Getty Images.

Nvidia’s two-year outlook

Nvidia has indicated that it has the ability to continue to grow revenue at a 50% compound annual growth rate (CAGR) over the next few years. The revenue consensus for its current fiscal year ending in January is around $206.5 billion. At that pace of growth, its 2027 revenue (essentially its fiscal year 2028 ending in January) would be around $465 billion.

If the company’s adjusted operating expenses were to rise by an average of 7% quarter over quarter during this stretch and its gross margin remained around 73%, and we apply a 15% tax rate on its operating income, Nvidia could generate nearly $260 billion in adjusted earnings by 2028 (fiscal 2029), or $10.50 per share, at its current share count of 24.5 billion. Place a 25 times-to-30 times price-to-earnings ratio (P/E) multiple on the stock, and its share price would be between $265 and $315 in two years.

Here is a basic model of what its revenue and earnings growth would look like.

  FY2026 FY2027 FY2028
Revenue

$207 billion

$310 billion $465 billion
Gross profit $151 billion $226 billion $339 billion
Adjusted operating expenses $21 billion $27 billion $35 billion
Operating income $130 billion $199 billion $304 billion
Net income $110 billion $169 billion $259 billion
EPS $4.50 $6.88 $10.51

Data source: Estimates based on author’s calculations.

All this means that while its stock has been a huge winner already, Nvidia’s stock still has plenty of upside potential over the next two years and beyond.

Geoffrey Seiler has no position in any of the stocks mentioned. The Motley Fool has positions in and recommends Nvidia. The Motley Fool has a disclosure policy.

Source link

Why Viasat Stock Soared 9% Higher This Week

Satellite telephony might just be coming into its own quickly.

Satellite telephony company Viasat (VSAT -1.30%) had quite a memorable week as far as its stock went. Driven by broad investor optimism on space-related titles generally and recent positive company-specific news items, it booked a near-double-digit gain over the period. According to data compiled by S&P Global Market Intelligence, Viasat’s share price rose in excess of 9% across the week.

Viable Viasat

What also helped was a live demonstration of its capabilities. On Thursday in Mexico City, Viasat put its direct-to-device satellite service through its paces.

A rocket on its trajectory.

Image source: Getty Images.

During the demonstration, Viasat sent text messages between two Android smartphones, one of which was linked to its satellite network and one through a traditional cellular matrix. It also flexed its satellite-powered services through a different device, the HMD Offgrid.

In the press release detailing the demonstration, the company quoted its general manager of Viasat Mexico Hector Rivero as saying that “This technology has the ability to bridge the connectivity gap in areas where traditional services are unreliable or non-existent, opening up possibilities for millions of individuals and devices to connect through satellite.”

“We are confident that this will have significant advantages for consumers and various industries worldwide,” he added.

Major contract in force

Viasat’s services seem to be striking a chord with major institutional customers, at least. Earlier this month, the company announced, no doubt happily, that it had earned a prime contract award from the U.S. Space Force. This will see it contribute to a dedicated satellite network for that branch of the American military.

Eric Volkman has no position in any of the stocks mentioned. The Motley Fool has no position in any of the stocks mentioned. The Motley Fool has a disclosure policy.

Source link

Why KLA Stock Crushed It This Week

The chip sector generally is benefiting from strong demand, which should only improve.

KLA (KLAC 0.81%), a company that makes crucial equipment for the manufacturing of microchips, was producing some tasty gains for its shareholders this week. These are frothy times for U.S. chip companies, and by extension, KLA should do well too. Over the course of the past few days, two bullish new takes from analysts bolstered the buy case for this company in particular.

According to data compiled by S&P Global Market Intelligence, KLA’s share price increased by nearly 13% over the course of the week on these tailwinds.

Components maker to the chip stars

Both of those prognosticator updates were published before the market open on Monday, helping to set the bullish tone for KLA stock in the subsequent days.

Person in a white lab coat working with a circuit board.

Image source: Getty Images.

The first came from Bank of America Securities’ Vivek Arya, who cranked his KLA price target a full 30% higher to $1,300 per share from his previous level of $1,000. He also maintained his buy recommendation on the stock.

According to reports, Arya wrote that he’s detecting signs of higher investment into dynamic random access memory (DRAM) production. On top of that, the great thirst for the advanced processors necessary to power artificial intelligence (AI) functionalities should help raise the fortunes of chipmakers generally — and their suppliers.

Another bull maintains his buy rating

Soon after that report was disseminated, Stifel‘s Brian Chin pulled the lever on a more modest raise. Chin lifted his KLA price target to $1,050 from $922. Like Arya, he kept his buy recommendation on the shares intact.

Both these takes feel realistic. Broadly speaking, this is a fine time to be invested in stocks throughout the chip sector, provided they’re not (yet) too expensive on their valuations.

Bank of America is an advertising partner of Motley Fool Money. Eric Volkman has no position in any of the stocks mentioned. The Motley Fool has no position in any of the stocks mentioned. The Motley Fool has a disclosure policy.

Source link

Why Oracle Fell Hard Today

After yesterday’s presentation, investors “sold the news” after a strong run in the stock over the past two months.

Shares of database and cloud giant Oracle (ORCL -6.72%) plunged as much as 8.1% on Friday, before recovering slightly to a 6.9% decline on the day.

Oracle held an analyst-attended Investor Day presentation yesterday, where the company clarified some of its long-term targets. While the guidance to 2030 was fairly impressive, it appears investors are “selling the news” after the stock’s tremendous gains over the past couple of months.

Oracle lives up to some of the hype, but investors wanted more

In the presentation, Oracle gave some more detail around its cloud infrastructure growth and margins out over the long term. Oracle’s cloud growth has been a subject of some debate, especially after the company announced a massive 359% growth in its cloud RPO in September to $455 billion, with the majority of that growth coming from a single contract with OpenAI.

Some were skeptical about that projection, as well as the margins on the project, given the huge customer concentration around OpenAI, with one analyst noting that Oracle was only making a 14% gross margin on its cloud infrastructure services today.

However, Oracle disclosed yesterday that it predicts between 30% and 40% gross margin on its large cloud infrastructure deals, which is higher than what was feared. Moreover, Oracle projected a whopping $225 billion in revenue by 2030, as well as $21 per share in earnings. Of that revenue, management expects about $166 billion to come from Oracle’s cloud infrastructure unit by that time.

Those targets were actually above the analyst consensus heading into the day. And yet, the stock still sold off on that news. After today’s plunge, Oracle’s stock trades around $291 per share, or 13.9 times that 2030 earnings figure.

That seems strikingly cheap, but investors should remember that it’s only 2025, and there is a time value of money to account for when valuing a stock through the discounted cash flow method.

Moreover, a 30% to 40% gross margin on the cloud operations may still be disappointing to some, given that leader Amazon Web Services has already achieved a 36.8% operating margin — not gross margin, but operating margin — over the past 12 months.

Data center servers in a row in a large data center.

Image source: Getty Images.

Oracle made its big AI play, and investors are divided

It should be noted that while investors are selling the news today, analysts are actually raising their Oracle price targets, with sell-side analysts at Guggenheim and T.D. Cowen both raising their price targets to $400, up from $375, after the event.

Oracle has made its AI gambit by partnering with OpenAI, betting big on the success of the current industry leader. OpenAI has committed to hundreds of billions in cloud contracts, even though it’s currently losing money, having made a reported $4.3 billion in revenue in the first half of 2025 and burning through $2.5 billion in cash.

So, Oracle’s anticipated growth may carry more risk than the typical cloud giant, and it appears investors took some of that risk off the table on Friday.

Billy Duberstein and/or his clients have positions in Amazon. The Motley Fool has positions in and recommends Amazon and Oracle. The Motley Fool has a disclosure policy.

Source link

Autoliv (ALV) Q3 2025 Earnings Call Transcript

Image source: The Motley Fool.

Date

Friday, Oct. 17, 2025, at 8 a.m. ET

Call participants

  • President & Chief Executive Officer — Mikael Bratt
  • Chief Financial Officer — Fredrik Westin
  • Vice President, Investor Relations — Anders Trapp

Need a quote from a Motley Fool analyst? Email [email protected]

Risks

  • Regional Production Mix — Adjusted operating margin was negatively impacted by a 20 basis point dilution in Q3 2025, due to not-yet-recovered tariffs and the partial recovery of tariff compensations.
  • Engineering Income Decline — “We expect higher depreciation costs due to new manufacturing capacity to meet demand in the key regions, and that the temporary decline in engineering income will persist, driven by the timing of specific customer development projects,” said CEO Mikael Bratt.
  • European OEM Production Stoppages — “We continue to see downside risks for Europe’s light vehicle production, driven by announced production stoppage at several key customers,” explained Bratt.

Takeaways

  • Net Sales — $2.7 billion, up 6% year-over-year, with organic sales growth of 4% excluding currency effects and including tariff compensation.
  • Adjusted Operating Income — $271 million, up 14% year-over-year, with a 10.0% adjusted operating margin, 70 basis points above last year.
  • Gross Margin — 19.3%, an increase of 130 basis points year-over-year, primarily driven by improved direct labor efficiency, headcount reductions, and supplier compensation.
  • Operating Cash Flow — $258 million in operating cash flow, representing a 46% increase, supported by higher net income and a net $53 million negative impact from working capital.
  • Free Operating Cash Flow — $153 million in Q3 2025 compared to $32 million in Q3 2024, due to higher operating cash flow and a $40 million reduction in net capital expenditures.
  • Adjusted EPS — Diluted adjusted earnings per share increased 26% or $0.48, mainly from $0.29 higher operating income, $0.09 taxes, and $0.08 lower share count.
  • Shareholder Returns — Dividend raised to $0.85 per share; $100 million in share repurchases completed, with 0.8 million shares retired.
  • China Performance — Sales to Chinese domestic OEMs grew by nearly 23%, outpacing their light vehicle production growth by 8%.
  • India Performance — India contributed one-third of global organic growth, now representing 5% of total sales, with content per vehicle rising from $120 in 2024 to $140 in 2025.
  • Tariff Compensation — 75% of tariff costs recovered; remainder expected to be compensated by year-end.
  • Capital Expenditures — CapEx net was 3.9% of sales, down from 5.7% in Q3 2024, with company guidance now at 4.5% for the full year 2025.
  • Leverage Ratio — Net leverage at 1.3 times, maintained below the 1.5 times target.
  • Strategic Initiatives — New second R&D center in China, partnership with CATARC, and a joint venture with HSAE to produce advanced safety electronics announced.
  • Outlook and Guidance — Organic sales projected to increase by ~3% and adjusted operating margin expected at 10%-10.5% for full-year 2025; operating cash flow guidance of ~$1.2 billion; tax rate forecasted at ~28%.

Summary

Autoliv (ALV -2.72%) delivered record net sales and adjusted operating income in Q3 2025, reflecting successful execution of efficiency initiatives. Management confirmed transactions to deepen presence in China and cited the joint venture with HSAE as an entry into advanced automotive safety electronics. Working capital increased by $197 million in Q3 2025 compared to Q3 2024, mainly due to higher accounts receivable from strong sales and delayed tariff reimbursements, which management described as temporary effects. The company achieved a 94% coil-off accuracy rate in Q3 2025, highlighting this improvement as a significant contributor to its operational targets. Light vehicle production outperformed the market, driven by strong organic momentum in India and among Chinese OEMs, although negative regional and customer mixes offset some gains in Q3 2025.

  • Chief Financial Officer Fredrik Westin said, “The $50 million there is a one-time, and it is compensation from a supplier for historical costs that we had versus our customers there. It is one time in the quarter here, for previous costs that we have had.”
  • Management noted, “we expect to be in the middle of the range” for full-year 2025 adjusted operating margin guidance, after citing headwinds from lower out-of-period inflation compensation, higher depreciation, and temporary engineering income declines heading into the fourth quarter.
  • CEO Mikael Bratt stated, “Expanding in China is key to strengthening Autoliv’s innovation, global competitiveness, and long-term growth,” underlining China as a principal driver of strategy and resource allocation.
  • The shift toward normalized capital expenditures follows the completion of large-scale, multi-region footprint investments over recent years, enabling lower capital intensity moving forward.

Industry glossary

  • Coil-off Accuracy: Percentage metric tracking adherence of parts inventory depletion to schedule, reflecting production planning effectiveness and supply chain reliability.
  • OEM: Original Equipment Manufacturer; refers here to carmakers that buy Autoliv’s safety products for installation in new vehicles.
  • ECU: Electronic Control Unit, a core component in automotive electronics, governing safety features like active seatbelts and detection systems.
  • RD&E: Research, Development & Engineering expenses, comprising spending on new products, process improvement, and engineering-driven customer projects.
  • CapEx: Capital expenditures, defined as spending on property, plant, and equipment.

Full Conference Call Transcript

Operator: Good day, and thank you for standing by. Welcome to the Autoliv, Inc. third quarter 2025 financial results conference call and webcast. (Operator Instructions) Please note that today’s conference is being recorded. I would now like to turn the conference over to your first speaker, Anders Trapp, Vice President of Investor Relations.

Please go ahead.

Anders Trapp: Thank you, Lars. Welcome, everyone, to our third quarter 2025 earnings call. On this call, we have our President and Chief Executive Officer, Mikael Bratt; our Chief Financial Officer, Fredrik Westin; and me Anders Trapp, VP, Investor Relations. During today’s earnings call, we will highlight several key areas, including our record-breaking third quarter sales and earnings, as well as our continued strategic investments to drive long-term success with Chinese OEMs. We also provide an update on market developments and the evolving tariff landscape impacting the automotive industry.

Finally, our robust balance sheet and strong asset returns reinforce our financial resilience and support sustained high levels of shareholder returns. Following the presentation, we will be available to answer your questions. And as usual, the slides are available at autoliv.com.

Turning to the next slide, we have the Safe Harbor Statement, which is an integrated part of this presentation and includes the Q&A that follows. During the presentation, we will reference some non-U.S. GAAP measures. The reconciliations of historical U.S. GAAP and non-U.S. GAAP measures are disclosed in our quarterly earnings release available on autoliv.com and in the 10-Q that will be filed with the SEC or at the end of this presentation. Lastly, I should mention that this call is intended to conclude with a reach CET, so please wait for your questions in person. I now hand it over to our CEO, Mikael Bratt.

Mikael Bratt: Thank you, Anders. Looking on the next slide, I am pleased to share yet another record-breaking quarter, underscoring our strong market position. This success is a testament to the strength of our customer relationships and our commitment to continuous improvement as we navigate the complexities of tariffs and other challenging economic factors. We saw a significant sales growth driven by higher-than-expected light vehicle production across multiple regions, especially in China and North America. Our high growth in India continues, accounting for one-third of our global organic growth. I am pleased to highlight that our sales growth with Chinese OEMs has returned to outperformance, driven by recent product launches and encouraging development.

Looking ahead, we anticipate to significantly outperform light vehicle production in China during the fourth quarter. We improved our operating profit and operating margin compared to a year ago. This strong performance was primarily driven by well-executed activities to improve efficiency, higher sales, and a supplier compensation for an earlier recall. We successfully recovered approximately 75% of the tariff costs incurred during the third quarter and expect to recover most of the remaining portions of existing tariffs later this year. The combination of not-yet-recovered tariffs and the dilutive effects of the recovered portion resulted in a negative impact of approximately 20 basis points on our operating margin in the quarter.

We also achieved record earnings per share for the third quarter. Over the past five years, we have more than tripled our earnings per share, mainly driven by strong net profit growth but also supported by a reduced share count. Our cash flow remained robust despite higher receivables driven by higher sales and tariff compensations later in the quarter. Our solid performance, combined with a healthy debt level ratio, supports continuous strong shareholder returns. We remain committed to our ambition of achieving $300 to $500 million annual in stock repurchases, as outlined during our Capital Markets Day in June.

Additionally, we have increased our quarter dividend to $0.85 per share, reflecting our confidence in our continued financial strength and long-term value creation. Expanding in China is key to strengthening Autoliv’s innovation, global competitiveness, and long-term growth. To support our growing partnerships with Chinese OEMs, we are investing in a second R&D center in China. In October, we announced a new important collaboration in China, as illustrated on the next slide. We have signed a strategic agreement with CATARC, the leading research institution setting standards in the Chinese automotive sector. This partnership marks a new chapter in our commitment to shaping the future of automotive safety.

Together with CATARC, we aim to define the next generation of safety standards and enhance the safety on the roads in China and globally. We are also broadening our reach in automotive safety electronics, as shown on the next slide. We recently announced our plans to form a joint venture with HSAE, a leading Chinese automotive electronics developer, to develop and manufacture advanced safety electronics. The joint venture will concentrate on high-growth areas in advanced safety electronics, including ECUs for active seatbelts, hands-on detection systems for steering wheels, and the development and production of steering wheel switches.

Through this new joint venture, we intend to capture more value from steering wheels and active seatbelts while minimizing CapEx and competence expansions, enabling faster market entry with lower technology and execution risks. Looking now on financials in more detail on the next slide. Third quarter sales increased by 6% year-over-year, driven by strong outperformance relative to light vehicle production in Asia and South America, along with favorable currency effects and tariff-related compensations. This growth was partly offset by an unfavorable regional and customer mix. The adjusted operating income for Q3 increased by 14% to $271 million, from $237 million last year. The adjusted operating margin was 10%, 70 basis points better than in the same quarter last year.

Operating cash flow was a solid $258 million, an increase of $81 million, or 46% compared to last year. Looking now on the next slide, we continue to deliver broad-based improvements, with particularly strong progress in direct costs and SG&A expenses. Our positive direct labor productivity trend continues as we reduced our direct production personnel by 1,900 year-over-year. This is supported by the implementation of our strategic initiatives, including automation and digitalization. Our gross margin was 19.3%, an increase of 130 basis points year-over-year. The improvement was mainly the result of direct labor efficiency, headcount reductions, and compensation from a supplier.

Our G&E net costs rose both sequentially and year-over-year, primarily due to lower engineering income due to timing of specific customer development projects. Thanks to our cost-saving initiatives, SG&A expenses decreased from the first half-year level. Combined with the increased gross margin, this led to 70 basis points improvement in adjusted operating margin. Looking now on the market developments in the third quarter on the next slide. According to S&P Global data from October, global light vehicle production for the third quarter increased 4.6%, exceeding the expectations from the beginning of the quarter by 4 percentage points. Supported by the scrapping and replacement subsidy policy, we continue to see strong growth for domestic OEMs in China.

Light vehicle demand and production in North America have proven significantly more resilient than previously anticipated. In contrast, light vehicle production in other high-content-per-vehicle markets, namely Western Europe and Japan, declined by approximately 2% to 3%, respectively. The global regional light vehicle production mix was approximately 1 percentage point unfavorable during the quarter, despite the important North American market showing a positive trend. In the quarter, we did see coil-off volatility continue to improve year-over-year and sequentially from the first half-year. The industry may experience increased volatility in the fourth quarter, stemming from a recent fire incident at an aluminum production plant in North America and production adjustments by a key European customer in response to shifting demand.

We will talk about the market development more in detail later in the presentation. Looking now on sales growth in more detail on the next slide. Our consolidated net sales were over $2.7 billion, the highest for the third quarter so far. This was around $150 million higher than last year, driven by price volume, positive currency translation effects, and $14 million from tariff-related compensations. Excluding currencies, our organic sales growth by 4%, including tariff costs and compensations. China accounted for 90% of our group sales. Asia, excluding China, accounted for 20%. Americas for 33%, and Europe for around 28%. We outline our organic sales growth compared to light vehicle production on the next slide.

Our quarterly sales were robust and exceeded our expectations, driven by strong performance across most regions, particularly in the Americas, West Asia, and China. Based on light vehicle production data from October, we underperformed light vehicle production by 0.7% globally, as a result of a negative regional mix of 1.3%. We underperformed slightly in Europe, primarily due to an unfavorable model and customer mix. In the rest of Asia, we outperformed the market with 8%, driven primarily by strong sales growth in India and, to a lesser extent, in South Korea.

While the organic light vehicle production mix shifts continued to impact our overall performance in China, our sales to domestic OEMs grew by almost 23%, 8% more than their light vehicle production growth. Our sales development with the global customers in China was 5% lower than their light vehicle production development, as our sales declined to some key customers, such as Volkswagen, Toyota, and Mercedes. On the next slide, we show some key model launches. The third quarter of 2025 went through a high number of new launches, primarily in Asia, including China. Although some of these new launches in China remained undisclosed here due to confidentiality, the new launches reflect a strong momentum for Autoliv in these important markets.

The models displayed here feature Autoliv content per vehicle from $150 to close to $400. We’re also pleased to have launched airbags and seatbelts on another small Japanese vehicle, A-Cars. This is a meaningful forward step because Autoliv has historically had limited exposure to this segment in Japan. In terms of Autoliv’s sales potential, the Onvo L90 is the most significant. Higher content per vehicle is driven by front center airbags on five of these vehicles. Now looking at the next slide, I will now hand it over to Fredrik Westin.

Fredrik Westin: Thank you, Mikael. I will talk about the financials more in detail now on the slides, so turn to the next slide. This slide highlights our key figures for the third quarter of 2025 compared to the third quarter of 2024. The net sales were approximately $2.7 billion, representing a 6% increase. The gross profit increased by $63 million, and the gross margin increased by 130 basis points. The drivers behind the gross profit improvement were mainly lower material costs, positive effects from the higher sales, and improved operational efficiency. This was partly offset by negative effects from recalls and warranty, depreciation, and unrecovered tariff costs.

The adjusted operating income increased from $237 million to $271 million, and the adjusted operating margin increased by 70 basis points to 10.0%. The reported operating income of $267 million was $4 million lower than the adjusted operating income.

Adjusted earnings per share diluted increased 26% or by $0.48, where the main drivers were $0.29 from higher operating income, $0.09 from taxes, and $0.08 from a lower number of shares. This marks our ninth consecutive quarter of growth in adjusted earnings per share, underscoring the strength of our ongoing operational improvements and further bolstered by a reduced share count from our share buyback program. Our adjusted return on capital employed was a solid 25.5%, and our adjusted return on equity was 28.3%. We paid a dividend of $0.85 per share in the quarter, and we repurchased shares for $100 million and retired 0.8 million shares. Looking now on the adjusted operating income bridge on the next slide.

In the third quarter of 2025, our adjusted operating income increased by $34 million.

Operations contributed with $43 million, mainly from high organic sales and from the execution of operational improvement plans supported by better coil-off volatility. The out-of-period cost compensation was $8 million lower than last year. Costs for RD&E net and SG&A increased by $30 million, mainly due to lower engineering income. The net currency effect was $6 million positive, mainly from translation effects. Last year’s supplier settlement and this year’s supplier compensation combined had a $29 million positive impact. The combination of unrecovered tariffs and the dilutive effect of the recovered portion resulted in a negative impact of approximately 20 basis points on our operating margin in the quarter. Looking now at the cash flow on the next slide.

The operating cash flow for the third quarter of 2025 totaled $258 million, an increase of $81 million compared to the same period last year, mainly as a result of higher net income, partly offset by $53 million negative working capital effects. The negative working capital was primarily driven by higher receivables, reflecting strong sales and delayed tariff compensations toward the end of the quarter. Capital expenditures net decreased by $40 million. Capital expenditures net in relation to sales was 3.9% versus 5.7% a year earlier. The lower level of capital expenditures net is mainly related to lower footprint CapEx in Europe and Americas and less capacity expansion in Asia.

The free operating cash flow was $153 million compared to $32 million in the same period the prior year from higher operating cash flow and the lower CapEx net.

The cash conversion in the quarter, defined as free operating cash flow in relation to the net income, was around 87%, in line with our target of at least 80%. Now looking at our trade working capital development on the next slide. The trade working capital increased by $197 million compared to the prior year, where the main drivers were $165 million in higher accounts receivables, $8 million in higher accounts payables, and $40 million in higher inventories. The increase in trade working capital is mainly due to increased sales and temporarily higher inventories. In relation to sales, the trade working capital increased from 12.8% to 13.9%.

We view the increase in trade working capital as temporary, as our multi-year improvement program continues to deliver results. Additionally, enhanced customer coil-off accuracy should enable a more efficient inventory management. Now looking at our debt leverage ratio development on the next slide.

Autoliv’s balanced leverage strategy reflects our prudent financial management, enabling resilience, innovation, and sustained stakeholder value over time. The leverage ratio remains low at 1.3 times, below our target limit of 1.5 times, and has remained stable compared to both the end of the second quarter and the same period last year. This comes despite returning $530 million to shareholders over the past 12 months. Our net debt increased by $20 million, and the 12 months trailing adjusted EBITDA was $41 million higher in the quarter. With that, I hand it back to you, Mikael.

Mikael Bratt: Thank you, Fredrik. On to the next slide. The outlook for the global auto industry has improved, particularly for North America and China.

While the industry continues to navigate the trade volatility and other regional dynamics, S&P now forecasts global light vehicle production to grow by 2% in 2025, following growth of over 4% in the first nine months of the year. Their outlook for the fourth quarter has significantly improved. Nevertheless, they still anticipate a decline in light vehicle production of approximately 2.7% in the quarter. In North America, the outlook for light vehicle production has been significantly upgraded, driven by resilient demand and low new vehicle inventories. However, a recent fire incident at an aluminum production plant in North America may impact our customers.

For Europe, S&P forecasts a 1.8% decline in light vehicle production for the fourth quarter, despite some easing of U.S. import tariffs. We continue to see downside risks for Europe’s light vehicle production, driven by announced production stoppage at several key customers.

In China, light vehicle production is expected to decline by 5%, primarily due to an exceptionally strong Q4 in 2024. Nevertheless, S&P anticipates sustained growth in Chinese LVP over the medium term, supported by favorable government policies for new energy vehicles, more relaxed auto loan regulations, and increasing export volumes. The outlook for Japan’s light vehicle production has improved, as car makers are increasingly shifting exports to markets outside the U.S., aiming to mitigate reduced export volumes to the U.S. In South Korea, domestic demand has been steadily recovering, while exports have also risen, driven by increased shipments to other regions, compensating for the decline in exports to the U.S. Now looking on our way forward on the next slide.

We expect the fourth quarter of 2025 to be challenging for the automotive industry, with lower light vehicle production and geopolitical challenges.

However, our continued focus on efficiency should help offset some of these headwinds. Consistent with typical seasonal patterns, the fourth quarter is expected to be the strongest of the year. Despite the expected decline in global light vehicle production year-over-year, we foresee higher sales and continued outperformance, particularly in China. Unfortunately, we are also facing some year-over-year headwinds. Unlike the past three years, we do not expect out-of-period inflation compensation in the fourth quarter, given the shift in the inflationary environment. We expect higher depreciation costs due to new manufacturing capacity to meet demand in the key regions, and that the temporary decline in engineering income will persist, driven by the timing of specific customer development projects.

These factors combine in the reason for why we currently expect the full-year adjusted operating margin to come in at the midpoint of the guided range.

However, our solid cash conversion and balance sheet provide fast expansions and a robust foundation for maintaining high shareholder returns. Turning to the next slide. This slide shows our full-year 2025 guidance, which excludes effects from capacity alignment and antitrust-related matters. It is based on no material changes to tariffs or trade restrictions that are in effect as part of 2025, as well as no significant changes in the macroeconomic environment or changes in customer coil-off volatility or significant supply chain disruptions. Our organic sales are expected to increase by around 3%. The guidance for adjusted operating margin is around 10% to 10.5%.

With only one quarter remaining of the year, we expect to be in the middle of the range. Operating cash flow is expected to be around $1.2 billion. We now expect CapEx to be around 4.5% of sales, revised from the previous guidance of around 5%.

Our positive cash flow and strong balance sheet support our continued commitment to a high level of shareholder return. Our full-year guidance is based on a global light vehicle production growth of around 1.5% and a tax rate of around 28%. The net currency translation effect on sales will be around 1% positive. Looking on the next slide. This concludes our formal comments for today’s earnings call, and we would like to open the line for questions from analysts and investors. I now hand it back to Ras.

Operator: Thank you, Sir. As a reminder to ask a question, please press star 1 and 1 on your telephone and wait for your name to be announced. To withdraw your question, please press star 1 and 1 again. Once again, please press star 1 and 1 and wait for your name to be announced. To withdraw your question, please press star 1 and 1 again. We are now going to proceed with our first question. The questions come from the line of Colin Langan from Wells Fargo Securities. Please ask your question.

Colin Langan: Oh, great. Thanks for taking my questions. You raised your light vehicle production forecast, you know, from down a half to up 1.5%, but organic sales didn’t change. Why aren’t you seeing any benefit from the stronger production environment on your organic?

Fredrik Westin: Yeah. Thanks for your question. There are a couple of components here. I mean, the first one is that some of these adjustments that we also now take into account are for past quarters. Some of the volumes have been raised also in the first half, whereas we had already recorded our sales for that. That doesn’t, yeah. We had a different outdoor underperformance in the first half of the year. That’s one part of the explanation. We also see a larger negative mix now after nine months and also expect that for the full year.

That is close to 2 percentage points, this negative market mix, which is also one of the reasons, and that’s, say, even less unfavorable now than we saw a quarter ago. Those are some explanations.

On top of that, we see that some of the launches in China have been a bit delayed, and that they are not coming through fully in line with our expectations that we had here about a quarter ago. Those are the main reasons why you don’t see that LVP estimate increase come through on our organic sales guidance.

Colin Langan: Got it. The margin in the quarter was very strong. I thought Q3 is typically one of your weaker margins. Anything unusual in the quarter? I noticed you flagged supplier settlements. I kind of get the non-repeat of bad news last year. Is the $15 million of supplier compensation additional good news? Is that one-time in nature? How should we think of that? Anything else that’s maybe possibly one-time in nature in the quarter that drove the strong margin?

Fredrik Westin: Yeah. The $50 million there is a one-time, and it is compensation from a supplier for historical costs that we had versus our customers there. It is one time in the quarter here, for previous costs that we have had. I would say here also that, I think what you saw in the quarter here was that we had slightly higher sales than expected. That was an important component, of course. I think most importantly here is that we continue to see a very strong delivery of the internal improvement work that we are so focused on and that we have been focused on for a while, leading to our targets here.

Good work done by the whole Autoliv team here across the whole value chain.

Colin Langan: Got it. All right. Thanks for taking my questions.

Operator: Thank you. We are now going to proceed with our next question. The questions come from the line of Björn Inoson from Danske Bank. Please ask your question.

Björn Inoson: Hi. Thanks for taking my question. On your implied guidance for Q4 and also on your a little bit cautious comments on Q4, it looks like there are a little bit of temporary negative effects that you are talking about. Should we extrapolate the Q4 trends looking into 2026? Are you quite happy with the productivity work and also that coil-offs look again a little bit better? Should we have as a base assumption that you should progress again towards the midterm target of 12%? How should we look upon that? Thank you.

Fredrik Westin: Yeah. I think, first of all, that we feel confident when it comes to our ability to eventually get to our 12% target. No doubt about that. What you see here in the Q3, Q4 movement is nothing if you read into that. I think, as I said before, we see very good progress in terms of the activities that we control ourselves. We see really good traction when it comes to the strategic initiatives that we have outlined some time back. Good progress there. I think when you look at Q4 over Q4, it’s, I would say, more of, first of all, a normalization of the quarters. Q4 is still the strongest quarter in the year.

Of course, in the previous last two, three years, it has been more pronounced since we had this out-of-period compensation that we referred to earlier, which you will not see in the same way now in this quarter in Q4 2025. There is a difference there. I would say also, you have seen a little bit stronger Q3 when it comes to sales. There is a timing effect between Q3 and Q4 compared to when we looked into the second half. There is also a part of the explanation. The bottom line, we feel comfortable with our own progress towards the targets that we have. Maybe just to build on that, just one more detail on the fourth quarter.

We do expect that we will have a slightly lower engineering income also in the fourth quarter, as you saw now in the third quarter.

This is temporary, and it’s very dependent on how the engineering activities are with certain customers. This should then also recover in 2026.

Björn Inoson: Okay. Yeah. I saw that comment. Did you say it’s likely to be recovered in early next year then?

Fredrik Westin: In next year overall, yes.

Björn Inoson: Overall. Okay.

Fredrik Westin: You should see a recovery ratio that is more in line with or a bit higher now than what you see in the second half of this year. That’s, again, very dependent on engineering activities with certain customers and how they reimburse us.

Björn Inoson: Okay. Got it.

Fredrik Westin: Yeah. In some cases, it’s built in the piece price. In some cases, it’s paid like engineering income specifically. Depending on how that mix looks over time, of course, you have some smaller fluctuation. That is really what we refer to here.

Björn Inoson: Okay. Very clear. Thank you.

Operator: Thank you. We are now going to proceed with our next question. The questions come from the line of Gautam Narayan from RBC Capital Markets. Please ask your question.

Gautam Narayan: Hi. Thanks for taking the question. Maybe a follow-up to that last one, the Q4 guidance. You call out three headwinds: the less compensation on inflation, I guess the higher depreciation, and then this engineering income. Just wondering if you could dimensionalize those three in terms of order of magnitude for Q4. I mean, we know the engineering income is temporary. The other two, you know, I guess, depends on certain factors. Just trying to dimensionalize those three in terms of what is temporary and what continues. I have a follow-up.

Fredrik Westin: Yeah. I think the engineering income, you can look at Q3 on a year-by-year basis and how that as a % of sales. That, I think, is a pretty good indication also for how that could be in the fourth quarter. That’s the largest headwind we will have. The next one is the fact that we had this out-of-period compensation from our customers related to inflation compensation last year. That falls away this year. That’s the second largest. The third largest is the depreciation expense increase.

Gautam Narayan: Okay. On the China commentary, we did see that BYD is losing share in China due to some government initiatives and whatnot. I would have thought that alone would maybe benefit you guys more. I know macro in China, the domestics are doing better than the globals. I see that. I understand that. Just wondering if the share loss that BYD is seeing—I know you’re under-indexed to them—is benefiting you guys. Thanks.

Fredrik Westin: Yeah. I mean, in the overall mix, of course, since we are only selling components to them, and you see their portion of the total market, you know, flattening out, of course, it’s supportive in the sense of measuring our outperformance relative to the COEMs, LVP as such. Mathematically, yes, you have that effect there.

Gautam Narayan: Great, thanks a lot. I’ll turn it over.

Operator: Thank you. We are now going to proceed with our next question. Our next questions come from the line of Michael Aspinall from Jefferies. Please ask your question.

Michael Aspinall: Thanks, Sam. Good day, Mikael, Fredrik, and Anders. One first on India. It was one-third of the organic growth. Can you just remind us where we are in the shift in content per vehicle in India, and how large India is in terms of sales now?

Fredrik Westin: Yeah. I think we are. See the strong development in India there. As I said, one-third of the growth in the quarter. It’s today around 5% of our turnover is coming from India. It’s not long ago, it was around 2%. A significant increase of importance there. We have a very strong market share in India, 60%. Of course, we are benefiting well from the volume growth you see there. We are expecting India to continue to grow. We have also invested in our investment footprint there to be able to defend our market share and to capture the growth here.

Content-wise, we expect it to go from, you know, it went from $120 in 2024 to roughly $140 this year. You have both content and light vehicle production growth in India to look forward to.

We expect it to go further up to around $160 to $170 in the next couple of years.

Michael Aspinall: Great. Excellent. Thank you. One more. Just on the JV with Hang Cheng, who were you purchasing these items from before? Were you purchasing from Hang Cheng and now to JV, or have you formed a JV with them and were purchasing from someone else previously?

Fredrik Westin: I mean, they have been an important supplier to us in the past as well. Of course, we have worked with them and established a very good relationship there. I couldn’t say it has been exclusively with them. We have a global supplier base here, but we see great opportunity here to not only produce but also develop components for our future models and programs here as we work together here, both on development and manufacturing.

Michael Aspinall: Okay. They’re moving, I guess, from a supplier, and now you guys are going to be working together?

Fredrik Westin: Yeah, yeah, exactly.

Michael Aspinall: Okay. Great. Thank you.

Fredrik Westin: Thank you.

Operator: Thank you. We are now going to proceed with our next question. The questions come from the line of Vijay Rakesh from Mizuho. Please ask your question.

Vijay Rakesh: Yeah. Hi, Mikael. Just quickly on the China side, I know you mentioned subsidies. When you look at the NEV and the scrapping subsidy, I believe it is down like 50% this year. Do you expect that to be extended to 2026, or is there going to be another step down? Then follow up.

Mikael Bratt: Yeah. I would say we are not speculating in that. I guess it’s anybody’s guess here. I think overall, we definitely look very positively on China. As we have mentioned here before, we are growing our share with the Chinese OEMs here and had good developments in the quarter here. We are also investing in China as well here. As I mentioned in the presentation here earlier, I mean, we are investing in a second R&D center in Wuhan to make sure that we also continue to work closer with the broader base of customers there, so adding capacity. We talked about JV just now here. The partnership with CATARC here is an important step here.

All in all, looking positively on China going forward here for sure. Subsidies or not, we will see, but overall, it’s pointing in the right direction here.

Vijay Rakesh: Got it. As you look at the European market, a lot of talk about price competition and imports coming in from Asia and tariffs, etc. How do you see the European auto market play out for 2026? Thanks.

Mikael Bratt: Yeah. I think we wait to comment on ’26 for the next quarterly earnings here when it’s time for it. As we have said here for the remainder of the year, we are cautious about the European market more from a demand point of view than anything else. I think that’s really the main question mark around the market than anything else in terms of OEM reshuffling or anything like that. I mean, it’s really the end consumer question here.

Vijay Rakesh: Got it.

Mikael Bratt: When it comes to Europe.

Vijay Rakesh: Yeah.

Operator: Thank you. We are now going to proceed with our next question. The questions come from the line of Emmanuel Rosner from Wolfe Research. Please ask your question.

Emmanuel Rosner: Oh, great. Thank you so much. My first question is actually a follow-up. I think on Colin’s question around the organic growth outlook, which is unchanged despite the better LVP. I’m not sure that I understood all the factors, but if we wanted to frame it as like growth above market, initially, you were going to grow 3% despite a shrinking market. Now you’re growing 3% in a market that would be growing 1.5%. Can you maybe just go back over the factors that are driving this different expectations for outperformance?

Fredrik Westin: Yeah. In that sense, the largest change over the capital quarters here since we started the year is the negative market mix. As I said, we now see a negative market mix for the full year of around 2%. That has deteriorated over the course of the year. That’s the largest part. We have also seen here in the third quarter the negatives in customer mix for us, mostly in North America and Europe. That’s also a deviation to what we expected going into the year. The last one that I already mentioned before is that we see some delays on the new launches, in particular in China.

They’re not coming through at the same pace that we had expected originally.

Emmanuel Rosner: Understood. Thank you. If I go back to your framework and your midterm margin targets, can you just maybe remind us the drivers that will get you from the 10 to 10.5% this year to towards the 12%? Where are we tracking on some of those? I did notice that you mentioned improved coil-off accuracy, both sequentially and year-over-year. Is that something that you expect to continue in and that will be helpful for that?

Fredrik Westin: Yeah. I mean, the framework has not changed as you would probably expect. It’s still, if we take 2024 as the base point with 9.7% adjusted operating margin, we still expect 80 basis points improvement from the indirect headcount reduction. In the reported numbers here now, you don’t see a movement in that, but we had about 260 employees from a labor law change in Tunisia that we now have to account for headcount. That distorts that number. If you adjust for that, we would also have shown further progress on the indirect headcount reduction. That is well on track. We said 60 basis points from normalization of coil-offs. That is developing well.

We saw 94% coil-off accuracy here and also in the third quarter, which is an improvement on a year-over-year basis.

We also talked about that we have decreased our direct headcount by 1,900 people despite that organic growth was at 4% on a year-over-year basis. That’s tracking very well. The remaining 90 basis points would be from growth component, where we are maybe a little bit behind now this year as we laid, or as you talked about before, and from automation digitalization. There again, you can see, I think, on the gross margin, even if you exclude the settlement here with a supplier, you can also see there that we are progressing well on that component.

Emmanuel Rosner: Thank you.

Operator: Thank you. We are now going to proceed with our next question. The questions come from the line of Jairam Nathan from Daiwa Capital Markets America. Please ask your question.

Jairam Nathan: Hi. Thanks for taking my question. I just wanted to kind of go back to the announcement out of China. I just wanted to understand better the timing. It seems it kind of coincided with also the announcement of Adient, the zero-gravity product. Just one, is this timing related to some new business win or more opportunities there?

Fredrik Westin: You’re talking about JV or?

Jairam Nathan: The JV, the CATARC partnership, as well as the kind of announced you kind of finalized the Adient zero-gravity product. Yeah.

Fredrik Westin: I was going to say they’re not connected at all as such. The JV here is really to vertically integrate in an effective way together with a partner to gain a broader product offering here to say that we offer also, yeah, more to our end customer, basically. CATARC is, of course, a development collaboration to make safer vehicles, safer roads for everyone. It’s including light vehicles, commercial vehicles, and vulnerable road users, meaning two-wheelers, etc. It is a broad-based research collaboration there. The Adient, of course, is connected to the zero-gravity. I mean, yeah, to some extent, of course, they are all about safety products as such, but they are not connected in any way.

Jairam Nathan: Okay. Thanks. Just to follow up, I wanted to understand the lower CapEx. Is that something that can be maintained as a % of sales into the future?

Fredrik Westin: Yeah. I think, I mean, we have been talking about this in the past also that our ambition is to bring down the CapEx levels in relation to sales compared to where we have been. We have been through a cycle here where we have invested a lot in our facilities around the world, Europe, where we have consolidated and upgraded a number of plants, India investments we talked about before, expanding capacity in China. We also upgraded in Japan, etc. In the last couple of years, we have invested heavily in upgrading our industrial footprint. We are coming out now into a more normalized phase here. That is why we can bring it down here.

We are not expecting to see CapEx jump up back in the near term here.

Jairam Nathan: Okay, thank you. That’s fine.

Operator: Thank you. We are now going to proceed with our next question. The questions come from the line of Hampus Engellau from Handelsbanken. Please ask your question.

Hampus Engellau: Thank you very much. A quick question from my side. Maybe a bit of a nitty-gritty question, but if I remember correctly, you covered about 80% of the tariff cost in the second quarter, and the remaining 20% came in Q3. Now you’re moving around 20% for Q3 you will get in Q4. Is the net effect like 100% compensation if you account for the things that came from second quarter to Q3, or are you still a net negative there on the margin?

Fredrik Westin: Yeah, please go ahead. …  Oh, please go ahead. … Okay. Yeah. Sorry. Let’s take this first, so we’re done with that one. We are still net negative here. As we said, we have received some of the outstanding $20 million in the second quarter in Q3, but most of it remains still. In the third quarter here, we got $75 million. We have accumulated more outstandings from Q2 to Q3. As we have indicated here, we still expect to get full compensation and catch up on this in the fourth quarter close. I think we are fully compensated. That’s our expectations here. Of course, the work is ongoing here as we speak with that, but that’s the net result right now.

Hampus Engellau: Fair enough. The last question was more related to from what you see today in terms of launches for 2026, and you maybe compare that to 2025 if you could share some light on that.

Fredrik Westin: I have no figure yet for 2026 to share with you here, but I think in general terms, I mean, we have a good order intake here to support our overall market position here. We see, however, some mixed, especially on the EV side, planned programs or launches being delayed or canceled here. There are some reshuffling there. What kind of impact that will have in 2026 compared to 2025, we are not ready to communicate that yet. As I said, we have good order intake here to support our market position.

Hampus Engellau: Thank you very much.

Operator: Thank you. We are now going to proceed with our next question. The questions come from the line of Edison Yu from Deutsche Bank. Please ask your question.

Edison Yu: Hi. This is Winnie on for Edison. Thanks for taking the call. My first question is on the supplier contract news that came out of GM, indicating maybe like a more less favorable contract terms for suppliers on a go-forward basis. I’m just curious if this is something that’s more isolated and more depends on like the OEM, or do you see like heading into 2026 maybe a broader trend that can pose potentially as a headwind heading into next year? I have a follow-up.

Fredrik Westin: No, I don’t want to comment specific customer contracts or conditions here. Of course, it’s a constantly ongoing development here in terms of what the OEMs want to put into their contract. I would say that I see a good ability to manage those clauses and contracts that are put in front of us here. I must say I don’t feel any major concerns around a more difficult situation. I think we are quite successful in negotiating and settling contracts with our customers here. Nothing exceptional there from our point of view, I would say.

Edison Yu: Got it. Thank you. On the Ford supplier impact, you did mention some potential impacts into Ford Q. I was just curious if you can help us delineate that. Is that something to be concerned about, or is it more of a negligible impact for you guys?

Fredrik Westin: Yeah. I think, I mean, every car that is not produced is not a good thing, of course, especially for the customer in question here. You have seen the announcements made by the OEMs here. Just as a reference, the Ford 150 is around 1% of our global sales. It’s not good, but it’s manageable, I would say, from our point of view. Just as a reference.

Edison Yu: Thank you so much.

Operator: Thank you. We are now going to proceed with our next question. The questions come from the line of Dan Levy from Barclays Bank. Please ask your question.

Dan Levy: Hi. Great. Thank you for taking the question. I just wanted to follow up on that prior question. You know, the headlines on Xperia yesterday causing some potential supply issues. Just how much of that of a potential risk have you seen or heard on that in the fourth quarter for European production?

Fredrik Westin: For the European production, no, I think it’s too early to comment on that. I mean, it’s just a few days, hours, or almost into the situation here. I think, first of all, we have a very good supply chain team that are on alert here and are managing through the situation here. We have been here before with supply chain constraints. I would say the last couple of years, there’s been many topics here. The team is well prepared to maneuver through this. We’ll see and come back on that. I would say it’s too early to be too granular or too detailed around that. As I said, it’s early days here.

We don’t see too much yet from the customers.

Dan Levy: Thank you. Just as a follow-up, I wanted to double-click on the China performance. You did very well outperformance with the domestic OEMs. In spite of that, the total China performance was negative 3 points, even though the domestics are the clear majority. I think we were all a bit surprised. I know you sort of unpacked this a bit before in one of the prior questions. Can you maybe just explain the dynamics of why, even though you outperformed the domestics, the overall China performance was negative? What can you explain what flips going forward that is leading you to say that your China growth going forward should outperform?

Fredrik Westin: Yeah. I mean, we still, for us, as we said before here, we believe that we will see improvements here in the quarter to come. I think it is a really important milestone here, what we reported on the COEM outperformance, which was really strong here in the quarter. Still, the global OEMs is a bigger majority of our total sales, and some of our customers here that are significant had a negative mix impact on us this quarter, unfortunately. That was on the negative side here. We don’t see this as a major trend shift here. It’s a mixed effect that we see from quarter to quarter here.

I think the important takeaway here is that we see this strong growth development with the Chinese OEMs that is also growing their share of the total market.

Fredrik Westin: That sets us up for, I would say, good development in China over time.

Dan Levy: Okay. Thank you.

Operator: Given the time constraint, this concludes the question and answer session. I will now hand back to Mr. Mikael Bratt for closing remarks.

Mikael Bratt: Thank you very much, Ras. Before we conclude today’s call, I want to reaffirm our commitment to meeting our financial targets. We remain focused on cost efficiency, innovation, quality, sustainability, and mitigating tariffs. With ongoing market headwinds, we anticipate strong fourth quarter performance. Our fourth quarter call is scheduled for Friday, January 30, 2026. Thank you for your attention. Until next time, stay safe.

Operator: This concludes today’s conference call. Thank you all for participating. You may now disconnect your lines. Thank you.

Source link

UCLA vs. Maryland: Can the Bruins maintain their new ‘standard?’

p]:text-cms-story-body-color-text clearfix”>

Historians looking back at UCLA’s 2025 football season will peg the Penn State game as the Bruins’ first victory.

In ways both large and small, they will be wrong.

When Tim Skipper first took over the team a month ago, he placed a new opponent on the schedule: the locker room. The interim coach showed players pictures of how it should look, including the lockers and the surrounding floor.

They scrubbed the place and it’s been spotless ever since. Sort of like the Bruins’ play starting with that Penn State game.

“I think a clean locker room makes you a lot happier,” Skipper explained this week. “It shows team discipline and it shows you can win off the field, so now you can go ahead and get on the field.”

Skipper’s other primary motivational device — besides his highly transmissible energy — has been slogans. He started by telling his players to strain, to give everything they had in the pursuit of winning. After the Bruins beat Penn State, he asked players whether they were one-hit wonders. Now, his players having established they know what it takes to win following a smackdown of Michigan State, he’s asking them to maintain their approach.

At their Sunday meeting, the Bruins saw their new mantra — the standard is the standard — on a big screen.

“We have identified a style of play that we want to be, and it’s our job now to keep the standard the standard, you know, play with that fanatical effort, play with fundamentals, being smart, you know, all those things we just have to continue to do,” Skipper said. “But it’s not like something that’s just going to show up on Saturday. You have to practice about it. You have to work on it and not just talk about it.”

Can the Bruins keep it up after two consecutive victories? Here are five things to watch Saturday afternoon at the Rose Bowl when UCLA (2-4 overall, 2-1 Big Ten) faces Maryland (4-2, 1-2):

Source link

2 Growth Stocks to Invest $1,000 in Right Now

Broadcom and UiPath have big growth potential.

If you’re looking to put money to work in the market — say $1,000 — investing in some up-and-coming growth stocks could be a good route to take. Let’s look at two artificial intelligence (AI) stocks that could still be in the early days of a big ramp-up in growth.

Broadcom

Broadcom (AVGO -1.86%) has become the key architect for helping companies design custom AI chips, making it one of the most important players in the next phase of the AI infrastructure build-out. As companies look to increasingly loosen Nvidia‘s grip on the AI chip market, they are turning to Broadcom for help.

The company has already proved itself in its relationship with Alphabet, helping the cloud computing leader develop its highly successful tensor processing units (TPUs).

Broadcom expects just three of its established customers, which also include Meta Platforms and ByteDance, to represent a $60 billion to $90 billion opportunity by fiscal 2027. The midpoint of that estimate is more than the size of Broadcom’s entire current annual revenue base, which just shows you how big its custom-chip opportunity is.

The company recently announced a formal partnership with OpenAI to help develop and deploy 10 gigawatts of custom AI accelerators using Broadcom’s networking and Ethernet technology. The implications are enormous. A single gigawatt of data center capacity translates into tens of billions of dollars in hardware spending, meaning this partnership alone could represent a $100 billion annual opportunity in the coming years.

Broadcom has yet another new customer for its custom AI chips that ordered $10 billion worth of the semiconductors for next year. 

Now, with several of the world’s largest hyperscalers (companies that own huge data centers) as custom AI chip clients, Broadcom looks poised to see explosive growth in the coming years. This can be a good time to add shares before the company’s results start to really ramp up.

A bull statue trading stocks on a laptop.

Image source: Getty Images

UiPath

Another company that has the potential to accelerate its growth in the coming years is UiPath (PATH -3.77%). The company built its name around robotic process automation (RPA), which uses software bots to handle repetitive business tasks, but it’s now moving into what it calls agentic automation.

The company has been busy forming partnerships that strengthen this strategy. It’s now working with Nvidia to integrate its Nemotron models and NIM microservices, which can accelerate AI deployment in industries where data security is paramount. It has also teamed up with Alphabet to use its Gemini models for voice-activated automation. 

However, its most interesting collaboration is with Snowflake, a data warehousing and analytics company that stores customers’ structured data. There has been a belief that AI would disrupt its business, given how well AI works with unstructured data, but companies like Palantir have actually shown that AI models work best when they have clean, organized data.

By connecting with Snowflake’s Cortex AI system, UiPath AI orchestration tools can give customers insights using their own data in real time. That is a powerful resource that could help make AI more actionable in the real world.

UiPath’s growth temporarily slowed as the AI frenzy took off and customers reevaluated their spending priorities, but the underlying business is improving again. Its annual recurring revenue (ARR) climbed 11% to $1.72 billion last quarter, and cloud-based ARR surged 25%, showing that customers are embracing the company’s newer offerings. Net revenue retention stabilized at 108%, and operating margins have expanded significantly after the company implemented cost cuts.

UiPath’s open approach, acting as the “Switzerland” of AI agents, should appeal to enterprises that don’t want to be tied to one AI ecosystem, and it represents a huge growth opportunity.

More than 450 customers are already building AI agents on its platform, and almost all new customers are adopting both its RPA and AI products together. That’s a strong sign the company’s AI expansion isn’t cannibalizing its core business but enhancing it.

Despite this progress, the market hasn’t caught on yet: The stock trades at a price-to-sales (P/S) multiple of only 5 times 2026 analyst estimates. If growth continues to reaccelerate, the stock’s upside could be substantial.

Geoffrey Seiler has positions in Alphabet and UiPath. The Motley Fool has positions in and recommends Alphabet, Apple, Meta Platforms, Nvidia, Palantir Technologies, Snowflake, and UiPath. The Motley Fool recommends Broadcom. The Motley Fool has a disclosure policy.

Source link