money

Cuts to Social Security Would Leave Over 60% Financially Vulnerable

The federal government needs to act fast to save one of the country’s most important social programs.

As of July, over 53 million Americans receive Social Security retirement benefits. A good number of these recipients rely on the Social Security program for most or, in some cases, all of their retirement income, so it’s hard to overstate just how important the program continues to be.

According to the Nationwide Retirement Institute 2025 Social Security Survey, over 60% of Social Security recipients feel as though they’d be financially vulnerable if there were cuts to Social Security benefits. That’s not too surprising, given how much people rely on the social program.

However, what may be surprising is just how soon cuts to Social Security benefits could happen at the current pace of deficit that the program is running on.

Person sitting at kitchen table looking stressed while reviewing papers and using laptop.

Image source: Getty Images.

How Social Security funding works

Before discussing the likelihood of Social Security benefit cuts, it’s essential to understand how the program is funded, which is through payroll taxes. The current rate is 12.4%, with employers and employees paying 6.2% each, and self-employed people paying the full 12.4%.

This tax revenue is put into the Social Security Trust Fund, which consists of the Old-Age and Survivors Insurance (OASI) Trust Fund and the Disability Insurance (DI) Trust Fund. The OASI program pays benefits to retirees, their families, and survivors of deceased recipients; the DI program pays benefits to disabled workers and their families.

The idea is that working-age people pay into the system to support current retirees, with the understanding that once they’re retired, they’ll be on the receiving end of this support.

What’s the likelihood of benefits being cut?

The Social Security Administration’s (SSA) 2025 Social Security Trustees Report highlighted that the Social Security program cost $1.485 trillion in 2024, while generating only $1.418 trillion in revenue, leaving a $67 billion deficit for the year. Both major Social Security trust funds have experienced a decline over the past decade.

US Old-Age, Survivors, and Disability Insurance Trust Fund Assets at End of Year Chart

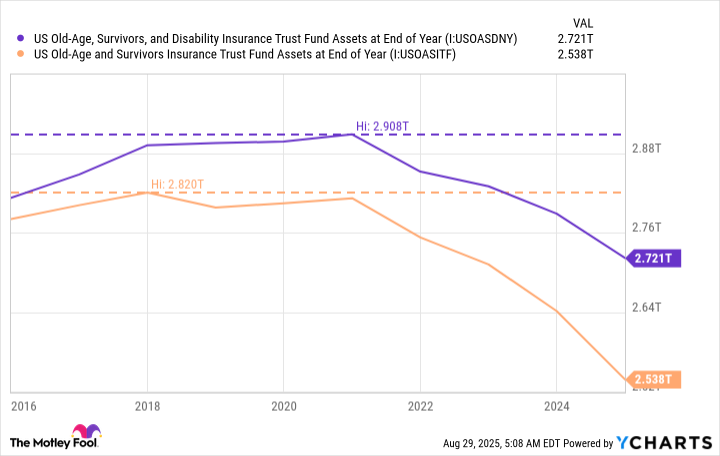
US Old-Age, Survivors, and Disability Insurance Trust Fund Assets at End of Year data by YCharts

The same report noted that the OASI trust fund could be depleted by 2033, which would leave the SSA with the ability to pay only 77% of its expected benefits. Considering the number of recipients from the Nationwide report who said cuts would make them financially vulnerable, this is, to put it lightly, far from ideal.

If the current depletion rate continues, the Social Security Trust Fund could be underfunded by more than $25 trillion through 2099 (the DI Trust Fund reserves are not projected to become depleted during this period). If no changes are made, Social Security would need to cut benefits by about 23% beginning in 2034.

According to the Nationwide study, 83% of respondents are concerned about Social Security’s long-term viability, and 74% are worried that the program’s funding could run out in their lifetime. Unfortunately, at the current pace and lack of concrete solutions, these concerns are justified.

What’s causing the current Social Security deficit?

There isn’t a single reason for the current Social Security deficit, but there are four main causes contributing to the problem. The first is that baby boomers are retiring in large numbers, and there aren’t enough tax-paying workers paying into the Social Security program.

The second “problem” is that people are living longer, meaning they’re collecting benefits longer, increasing how much Social Security has to pay out each year. This is good for people, but bad for Social Security.

We’ve also seen an increase in high earners, which means less of their income is being taxed and paid into the program. In 2025, the most income that’s subject to the Social Security payroll tax is $176,100. Any money earned above that is free from the tax.

The last problem is that before the interest rate hike a couple of years ago, interest rates spent a long period at historically low rates. This is a problem for Social Security because the reserves are put into Treasury bonds to earn interest. Low interest rates mean less money earned on these reserves.

All hope isn’t lost

To end on a more positive note, it’s worth pointing out that this isn’t the first time that Social Security has faced funding issues, and in previous times, the federal government has been able to “fix” the issue.

The American political environment is a bit more unpredictable nowadays, so I can’t say for certain if the same will happen. However, given the program’s importance to the livelihoods of millions of Americans, one would assume that it would become a priority for politicians on both sides of the aisle.

Source link

If I Could Only Buy 1 Artificial Intelligence (AI) Chip Stock Over The Next 10 Years, This Would Be It (Hint: It’s Not Nvidia)

While Nvidia continues to capture headlines, a critical enabler of the artificial intelligence (AI) infrastructure boom may be better positioned for long-term gains.

When investors debate the future of the artificial intelligence (AI) trade, the conversation generally finds its way back to the usual suspects: Nvidia, Advanced Micro Devices, and cloud hyperscalers like Microsoft, Amazon, and Alphabet.

Each of these companies is racing to design GPUs or develop custom accelerators in-house. But behind this hardware, there’s a company that benefits no matter which chip brand comes out ahead: Taiwan Semiconductor Manufacturing (TSM -3.05%).

Let’s unpack why Taiwan Semi is my top AI chip stock over the next 10 years, and assess whether now is an opportune time to scoop up some shares.

Agnostic to the winner, leveraged to the trend

As the world’s leading semiconductor foundry, TSMC manufactures chips for nearly every major AI developer — from Nvidia and AMD to Amazon’s custom silicon initiatives, dubbed Trainium and Inferentia.

Unlike many of its peers in the chip space that rely on new product cycles to spur demand, Taiwan Semi’s business model is fundamentally agnostic. Whether demand is allocated toward GPUs, accelerators, or specialized cloud silicon, all roads lead back to TSMC’s fabrication capabilities.

With nearly 70% market share in the global foundry space, Taiwan Semi’s dominance is hard to ignore. Such a commanding lead over the competition provides the company with unmatched structural demand visibility — a trend that appears to be accelerating as AI infrastructure spend remains on the rise.

A child looking into the distance through a telescope.

Image source: Getty Images.

Scaling with more sophisticated AI applications

At the moment, AI development is still concentrated on training and refining large language models (LLMs) and embedding them into downstream software applications.

The next wave of AI will expand into far more diverse and demanding use cases — autonomous systems, robotics, and quantum computing remain in their infancy. At scale, these workloads will place greater demands on silicon than today’s chips can support.

Meeting these demands doesn’t simply require additional investments in chips. Rather, it requires chips engineered for new levels of efficiency, performance, and power management. This is where TSMC’s competitive advantages begin to compound.

With each successive generation of process technology, the company has a unique opportunity to widen the performance gap between itself and rivals like Samsung or Intel.

Since Taiwan Semi already has such a large footprint in the foundry landscape, next-generation design complexities give the company a chance to further lock in deeper, stickier customer relationships.

TSMC’s valuation and the case for expansion

Taiwan Semi may trade at a forward price-to-earnings (P/E) ratio of 24, but dismissing the stock as “expensive” overlooks the company’s extraordinary positioning in the AI realm. To me, the company’s valuation reflects a robust growth outlook, improving earnings prospects, and a declining risk premium.

TSM PE Ratio (Forward) Chart

TSM PE Ratio (Forward) data by YCharts

Unlike many of its semiconductor peers, which are vulnerable to cyclicality headwinds, TSMC has become an indispensable utility for many of the world’s largest AI developers, evolving into one of the backbones of the ongoing infrastructure boom.

The scale of investment behind current AI infrastructure is jaw-dropping. Hyperscalers are investing staggering sums to expand and modernize data centers, and at the heart of each new buildout is an unrelenting demand for more chips. Moreover, each of these companies is exploring more advanced use cases that will, at some point, require next-generation processing capabilities.

These dynamics position Taiwan Semi at the crossroad of immediate growth and enduring long-term expansion, as AI infrastructure swiftly evolves from a constant driver of growth today into a multidecade secular theme.

TSMC’s manufacturing dominance ensures that its services will continue to witness robust demand for years to come. For this reason, I think Taiwan Semi is positioned to experience further valuation expansion over the next decade as the infrastructure chapter of the AI story continues to unfold.

While there are many great opportunities in the chip space, TSMC stands alone. I see it as perhaps the most unique, durable semiconductor stock to own amid a volatile technology landscape over the next several years.

Adam Spatacco has positions in Alphabet, Amazon, Microsoft, and Nvidia. The Motley Fool has positions in and recommends Advanced Micro Devices, Alphabet, Amazon, Intel, Microsoft, Nvidia, and Taiwan Semiconductor Manufacturing. The Motley Fool recommends the following options: long January 2026 $395 calls on Microsoft, short August 2025 $24 calls on Intel, short January 2026 $405 calls on Microsoft, and short November 2025 $21 puts on Intel. The Motley Fool has a disclosure policy.

Source link

Make No Mistake: President Donald Trump Has a Tariff Problem That Could Be a Roadblock for a Stock Market Hovering Around All-Time Highs

President Trump has said that tariffs won’t lead to an uptick in inflation.

Since President Donald Trump stared enacting tariffs earlier this year, everyone from Federal Reserve Chairman Jerome Powell to the average retail investor has been trying to figure out how they will affect the economy and whether they will reignite inflation.

So far, the economy and inflation seem to be OK. However, it’s still early, and the tariffs are constantly changing, which makes understanding the longer-term impact even more difficult.

The Trump administration and many in support of tariffs have said that they will not lead to higher inflation and have been lobbying Powell to lower interest rates. But make no mistake: President Trump has a tariff problem that could be a roadblock for a stock market hovering around all-time highs.

Somebody is going to have to bear the cost

Tariffs are a tax on imported goods, intended to make foreign goods more expensive, therefore aiding the competitive position of domestically made goods. So far, Trump’s tariffs have brought in significant revenue, including more than $29 billion in customs and excise taxes in July. In prior years, the monthly customs and excise taxes have amounted to less than $10 billion.

President Donald Trump gestures as he talks to reporters.

Official White House Photo by Tia Dufour.

However, most economists and other experts point out that someone has to foot the bill, which is why they are concerned about an eventual rebound in inflation. Up until now, inflation has remained subdued, or at least not risen like some expected, although core inflation rose in both June and July.

But the biggest indicator that higher inflation could be cooking came after a recent Producer Price Index (PPI) report. Although the PPI is not as widely followed as the Consumer Price Index (CPI), the July PPI certainly moved markets this month.

That index looks at the change in producer prices across industries and essentially serves as a gauge of wholesale inflation. What investors should think about is that if manufacturers are seeing price increases, how long until those funnel down and eventually hit consumers?

The July PPI increased 0.9% from the prior month, significantly higher than the consensus estimate of 0.2%. It was the biggest monthly increase since June of 2022, a period of extremely high inflation in the U.S.

CalBay Investments Chief Market Strategist Clark Geranen recently told CNBC: “The fact that PPI was stronger than expected and CPI has been relatively soft suggests that businesses are eating much of the tariff costs instead of passing them on to the consumer. Businesses may soon start to reverse course and start passing these costs to consumers.”

Prior to the PPI report, traders betting on changes in the federal funds rate had placed a nearly 99% chance that the Fed would cut interest rates at its September meeting. As of this writing on Aug. 19, that percentage had dropped to about 85%, according to CME Group‘s FedWatch tool.

The stock market is pricing in significant rate cuts

President Trump’s problem, in my view, is that the market is pricing in significant interest rate cuts. Between now and the end of 2026, the forward curve indicates there will be five cuts. While the market doesn’t necessarily want the Fed to have to make cuts due to some kind of severe recession or economic downturn, incremental cuts to support the economy and keep it on sound footing are expected to bolster the market, which seems to be a contributor in driving it to new all-time highs on numerous occasions this year.

Powell won’t cut rates five times if the Fed sees inflation moving higher, because that could put the economy in a stagflation scenario, where unemployment and inflation are both moving higher, making it more difficult for the Fed to achieve its dual mandate of stable prices and maximum employment.

I think the tariffs at the very least will keep the market and the Fed in a period of uncertainty, making it potentially difficult for the Fed to cut rates as much as the market hopes. With the stock market hovering near all-time highs and with a stretched valuation, I believe this dynamic could create a roadblock for the market.

Source link

Kohl’s Crushed Earnings Expectations, but Should You Buy the Stock Now?

Kohl’s managed to beat analyst expectations, which is good, but the retailer isn’t out of the woods just yet.

Shares of retailer Kohl’s (KSS -2.02%) rose a dramatic 24% in a single day on Aug. 27. The reason for that spike was the company’s second-quarter 2025 earnings update.

Based on the stock’s advance, it is pretty obvious that it contained some good news, which is true. But there was also some bad news. Here’s what you need to know beyond the fact that Kohl’s crushed earnings expectations.

What did Kohl’s achieve in the second quarter?

Heading into the quarter, Wall Street analysts were projecting Kohl’s to earn an adjusted $0.29 per share. The final tally, however, came in at $0.56 per share, nearly twice as much.

On the top line, revenue totaled $3.35 billion versus an expectation of $3.32 billion. Investors like it when a company beats on both the top and bottom lines, and they particularly appreciate when the bottom-line beat is so dramatic.

An exasperated person face down on a laptop keyboard.

Image source: Getty Images.

Given that backdrop, it shouldn’t be too surprising that Kohl’s stock rose. But there’s another factor here to consider, because the retailer has been struggling of late.

Without getting too deep into the details, the board of directors chose to part ways with the previous CEO without having found a replacement. That’s a troubling sign and, roughly three months on, the board has yet to find a permanent replacement.

The company’s income statement has been an eyesore for a while, too. Revenue and earnings have both been fairly weak since their post-pandemic bounce back. And that’s a problem that a single good quarter can’t paper over.

KSS Chart

KSS data by YCharts; TTM = trailing 12 months.

Kohl’s turnaround is still a work in progress

First off, until there’s a new permanent CEO in place, Kohl’s corporate direction can’t be counted on. A new CEO could come in to change course, as would be a rightful prerogative. So whatever internal changes may have led to the strong showing in the second quarter can’t exactly be extrapolated into the future with too much confidence.

But that strong showing also needs to be taken with a grain of salt. Sure, Kohl’s beat Wall Street expectations by a wide margin. That’s great news. But what exactly were the numbers? On the top line, Kohl’s brought in $3.35 billion. That figure is down 5.1% compared to the same quarter of 2024. Worse, same-store sales (comps), a metric tracking the performance of stores open for at least a year, fell 4.2%.

The company is not resonating well with customers right now. As a comparison, Dollar General, which is also working on a turnaround, saw sales rise 5.1% with a comps jump of 2.8%. It benefited from higher customer traffic and an increase in the amount customers spent on each visit.

When it comes to turnarounds, Dollar General’s rebound is clearly on sounder footing than the one that’s taking place at Kohl’s. In fact, comparatively, it is hard to suggest that Kohl’s is turning its business around.

To be fair, it did improve its gross margin and managed to cut costs, but the real story is that it did less badly than before. That’s a step in the right direction, but it is not the same as an upturn. And until customers start returning to its stores, this retailer is unlikely to be able to get back on track.

Good news, but not enough good news

Yes, Kohl’s had a strong second quarter compared to what Wall Street was expecting. It is hard to complain about that. However, there is still a lot of work to do with the retailer’s business and a huge amount of uncertainty. Only the most aggressive investors should be buying Kohl’s stock story.

And even then, you need to believe strongly that the business can stop the bleeding and turn things around. That’s a big ask when the company doesn’t even have a permanent CEO yet.

Source link

Billionaire Bill Ackman Has 58% of His Hedge Fund’s $13.8 Billion Portfolio Invested in Just 3 Companies

Ackman made a couple of big moves in Pershing Square’s portfolio.

Bill Ackman is one of the most closely followed investment managers on Wall Street. His Pershing Square Capital Management hedge fund holds just a handful of high-conviction positions, and he typically holds those positions for the long run.

Ackman is often forthcoming with the biggest moves in his portfolio. He’ll usually disclose new trades through his social media accounts or monthly updates to his hedge fund investors. But Pershing Square’s quarterly 13F filing with the Securities and Exchange Commission (SEC) can provide a full accounting of the hedge fund’s portfolio of publicly traded U.S. stocks.

Ackman made a couple of big moves last quarter, and now holds roughly 58% of the portfolio in just three companies.

A 3D rendering of a pie chart sitting on top of printouts of charts.

Image source: Getty Images.

1. Uber (20.6%)

Ackman made a massive investment in Uber Technologies (UBER -2.28%) at the start of 2025, accumulating 30.3 million shares for Pershing Square. That immediately made the stock the hedge fund’s largest position, and it’s only grown bigger since. Uber shares are up 57% so far in 2025 as of this writing.

Uber continues to see strong adoption for both its mobility and delivery service. Total users climbed to 180 million last quarter, up 15% year over year, and it saw a 2% increase in trips per user. Delivery gross bookings climbed 20% year over year and produced strong EBITDA margin expansion. As a result, the company saw adjusted EBITDA growth of 35% year over year.

But the threat of autonomous vehicles is weighing on Uber stock. Ackman believes self-driving cars will benefit Uber in the long run, as it operates the network required for connecting vehicles with riders. That kind of network effect is hard to replicate, giving Uber a competitive advantage and a significant stake in the autonomous vehicle industry. To that end, the company has already partnered with 20 different companies, including AV leader Alphabet‘s (GOOG 0.56%) (GOOGL 0.63%) Waymo.

Shares of Uber currently trade for about 1.2 times its gross bookings over the past year. But with expectations for growth in the high teens, that puts it down closer to a 1 multiple. That’s historically been a good price to pay for the stock. In more traditional valuation metrics, its stock price is 3.9 times forward revenue expectations. Its enterprise value of $206 billion as of this writing is less than 24 times 2025 adjusted EBITDA expectations. Even after its strong performance in 2025, Uber shares still look about fairly valued.

2. Brookfield Corp (19.7%)

Ackman built a position in diversified asset manager Brookfield Corporation (BN -0.08%) over the last five quarters, adding to it each quarter since Pershing Square’s initial purchase in the second quarter of 2024. As a result, the stock is now the hedge fund’s second-largest position.

Brookfield saw its distributable earnings excluding carried interest and gains from selling investments climb 13% on a per-share basis last quarter. The company expects to produce distributable earnings growth of 21% per year from 2024 through 2029.

A huge growth driver for Brookfield is its Wealth Solutions segment, which grew total insurance assets to $135 billion as of the end of June. Its annualized earnings are now $1.7 billion.

The business is growing quickly. Just two years ago, insurance assets totaled $45 billion. Management expects the growth to continue with assets topping $300 billion by 2029. At that point, the segment will be the conglomerate’s largest contributor to distributable earnings.

Management is using its free cash flow to buy back shares and invest in new assets. This could further increase distributable earnings per share above its guidance for 21% organic growth over the next few years. Shares currently trade for less than 20 times management’s expectations for 2025 distributable earnings, offering compelling value for investors.

3. Alphabet (17.9%)

Ackman first bought shares of Alphabet in early 2023, shortly after the release of OpenAI’s ChatGPT. While many saw the growth of generative AI as a major threat to Alphabet’s Google, Ackman thought the market overreacted, offering a bargain price for the stock. While he trimmed the position a bit in 2024, he’s added back to it over the first two quarters of 2025, preferring the Class A shares (which come with voting rights).

Alphabet has produced strong financial results in 2025. Its core advertising business climbed 10% year over year last quarter, with particularly strong results from Google Search (up 12%). That speaks to the company’s efforts to incorporate generative AI into its search business with features like AI Overviews and Google Lens. The former has increased engagement and user satisfaction, according to management, while the latter lends itself to high-value product searches.

Alphabet has seen tremendous results in its Google Cloud business, which supplies compute power to AI developers. Sales increased 32% year over year, with operating margin expanding to 22% for the business. Overall, Google Cloud accounted for 43% of the total increase in Alphabet’s operating earnings last quarter, despite its relatively small size compared to the Search business.

That said, the company faces potential regulatory challenges to its business. The Department of Justice has ruled that it operates an illegal monopoly. The company is awaiting a ruling on required remedies, which could include divesting its Chrome browser or a ban on contracts positioning Google as the default search engine in other browsers.

As a result, Alphabet shares trade for less than 21 times forward earnings expectations. That’s the lowest multiple among the “Magnificent Seven” stocks and a great price for one of the leading AI companies in the world.

Adam Levy has positions in Alphabet. The Motley Fool has positions in and recommends Alphabet, Brookfield, Brookfield Corporation, and Uber Technologies. The Motley Fool has a disclosure policy.

Source link

I’m Contributing $23,500 to My 401(k) This Year — Here’s How I Make It Work

I’m putting $23,500 into my 401(k) this year. If I do this for 10 years and earn an average 8% return, I’ll have over $340,000 in my 401(k) account. And continuing for 20 years would put me over $1 million.

It’s a big number to save, but I treat it like any other monthly bill. Here’s the system I’m using to make it all happen.

I treat it like a bill, not a leftover

I get paid twice a month, so to hit my $23,500 goal this year, I’ve set up about $1,000 to come out of every paycheck automatically.

Then I just live on what’s left. Some months I feel a squeeze. But other months I’ve totally been able to make it work and can even build a small buffer.

There’s a reason “pay yourself first” is one of the oldest rules in personal finance — because it actually works. If I had to manually save that much, I’d be battling temptation with every single paycheck (and let’s be honest, I’d probably lose that fight some months).

I cut back on things I don’t miss

To be real, I’ve had to make some trade-offs. But now that I’m being more intentional with my spending, I’m actually seeing a lot of positives come from it.

One area I’ve cut back on big time is buying my kids “stuff.” I want to spoil them — partly because I didn’t have much growing up. But now I think twice before jumping on Amazon or heading to Target just to grab something new.

Here’s a good example: this summer, my 6-year-old needed a new bike. My first instinct was to take him to Target and let him pick out a shiny $300 one. I wanted to see the look on his face!

But I fought the urge, hit pause, and decided to look for a cheaper option.

Sure enough, two days later, I met another parent at the park who gave us — no joke — two hand-me-down bikes for free. Both fit my son perfectly, and he couldn’t be happier.

It’s not just kids’ stuff. I’m rethinking every spending category in my life. All the money I’m saving here and there really adds up. And I don’t feel like I’m missing out at all.

I ignore the market and stick to the plan

In 2025, the 401(k) contribution limit is $23,500 (or $31,000 if you’re 50 or older.) So my plan is to contribute the maximum.

Since this is a retirement account I won’t touch for 20+ years, I’m not trying to beat the market or do any fancy investing. My plan is to invest in low-cost index funds, and let time and compounding do the heavy lifting.

And if I can consistently max out my 401(k) each year going forward, the payoff will be huge.

Here’s what my account could look like after a couple decades, assuming an 8% return (slightly under the S&P 500 historical ~10% average annual return):

Time

Future Value

10 years

$340,376

20 years

$1,075,223

Data source: Author’s calculations.

Of course, plans change and priorities shift over time. I don’t know if I’ll stick to this exact plan forever. But for now, I’m thinking long term with every dollar I put away.

I’m also building up a Roth IRA

My 401(k) isn’t the only place I’m saving retirement dollars. My wife and I also have Roth IRAs we contribute to every year. Our goal is to have both pre-tax and post-tax buckets of money to withdraw from.

Roth IRAs are especially great if you think you’ll be in a higher tax bracket later. And even if you can’t max one out right now, contributing a little bit each year still adds up.

Better yet, some brokers actually offer an IRA match! For example, right now SoFi Invest® offers a 1% match on IRA contributions (or eligible rollovers). Read our full SoFi Invest® review here to learn more.

One year at a time

So that’s my plan for 2025 — and hopefully for 2026 and beyond. Some years I might be able to max out both my 401(k) and Roth IRA. Other years, maybe not. And that’s OK.

What matters most is that I’m staying consistent, being thoughtful with my spending, and giving every dollar a job.

Ready to start or level up your retirement savings? Compare top brokers and find the right account for your goals.

Source link

What Is the Highest Procter & Gamble Stock Has Ever Been?

Dividend powerhouse Procter & Gamble (PG 0.94%) owns some of the world’s most valuable consumer brands, including Tide detergent, Crest toothpaste, Pampers diapers, and Bounty paper towels. But over the last year, its stock has badly lagged the S&P 500.

How high has P&G’s stock ever gotten? And can it get there again?

The top of the mountain

P&G stock hit its all-time closing high of $179.90/share on Dec. 2, 2024. But 2025 hasn’t been kind to the consumer staples behemoth. The stock is currently down more than 13% from its all-time high.

P&G shares beat the market from December 2018 to November 2023. P&G returned 83.4% to the S&P 500’s 81.4%.

Hand drawing a graph with upward arrow and increasingly larger dollar signs.

Image source: Getty Images.

Then, in December 2023, the S&P 500 rose sharply, while P&G’s stock declined. Even though P&G stock recovered the very next month, keeping pace with the S&P 500 for the next nine months, that one-month blip was enough to derail the company’s historical performance. A year later, on the day it hit its all-time high, its five-year total return of 65.7% badly trailed the S&P 500’s 110.3% total return.

What it tells us

This is a good reminder to look at multiple timeframes when researching a stock’s historical performance. I recommend comparing at least the one-, five-, and 10-year returns of a stock to the S&P 500 (and be sure to use total returns — which factor in reinvestment of dividends — when looking at dividend payers like P&G).

Today, P&G’s fundamentals look sound. Revenue is at all-time highs of $84.3 billion, and net income is up sharply at $16.1 billion over the same timeframe. The company plans to cut 7,000 jobs and shed a number of underperforming brands, focusing instead on its major moneymakers. But sales of P&G’s higher-priced brands may take a hit in the event of a recession, which is probably what’s weighing down the stock.

John Bromels has positions in Procter & Gamble. The Motley Fool has no position in any of the stocks mentioned. The Motley Fool has a disclosure policy.

Source link

If You’d Invested $1,000 in ExxonMobil Stock 5 Years Ago, Here’s How Much You’d Have Today

ExxonMobil shareholders have been very happy in recent years.

For years, ExxonMobil Corp (XOM 0.82%) was stuck in limbo. In 2007, for instance, Exxon stock traded at roughly $85 per share. In 2016, nearly a decade later, shares still traded at roughly $85 per share.

The past five years, however, have been very different. Exxon shareholders have crushed the market. You may be surprised to learn just how much a $1,000 investment would have become since the summer of 2020.

ExxonMobil shareholders are very happy about the last 5 years

As one of the largest oil stocks in the world, Exxon is heavily dependent on the prevailing price of oil. Five years ago arguably marks the nadir of the oil price collapse that occurred due to uncertainty surrounding the ongoing global pandemic. In April of 2020, oil prices fell as low as $20 per barrel! By August of that year, prices had already rebounded to around $40 per barrel, but that was still one-third below pre-pandemic levels.

Today, oil prices hover just above $60 per barrel due to rising costs and geopolitical tensions. Today’s price level is roughly 50% higher than it was five years ago, but Exxon’s stock price has risen significantly more.

oil worker watching rig

Source: Getty Images

If you had invested $1,000 into Exxon stock in August 2020, you’d have around $3,460 today. That figure includes dividend income — an important consideration given Exxon currently pays a dividend yield of 3.5%. Over the same time period, a $1,000 investment in the S&P 500 would have grown into just $2,000.

XOM Total Return Level Chart

XOM Total Return Level data by YCharts

Much of this outperformance stems from Exxon’s continued investments throughout the last bear market. With greater access to capital, the company was able to invest at rock bottom prices, highlighting the company’s capital advantage and savvy leadership. Exxon’s CEO called these strategic moves “counter-cyclical investments” — an appropriate term for a business that can deploy capital at every stage of a cyclical industry.

Ryan Vanzo has no position in any of the stocks mentioned. The Motley Fool has no position in any of the stocks mentioned. The Motley Fool has a disclosure policy.

Source link

Prediction: 1 Artificial Intelligence (AI) Stock Will Be Worth More Than Nvidia and Palantir Technologies Combined by 2030

Meta Platforms is using artificial intelligence to strengthen its advertising business, and its Orion augmented reality glasses could be the next big consumer electronics product.

Interest in artificial intelligence went parabolic following the release of ChatGPT in late 2022. Since then, Nvidia stock has advanced 1,090% to a market value of $4.2 trillion. And Palantir Technologies stock has climbed 2,340% to a market value of $370 billion. That means the companies are collectively worth $4.6 trillion.

I predict Meta Platforms (META -1.69%) will surpass that figure in no more than five years (i.e., before the end of 2030). The company is currently worth $1.9 trillion, which means its share price must increase by about 247% for its market value to reach $4.7 trillion. Here’s why I think that could happen.

A bull figurine stands in front of stock price charts.

Image source: Getty Images.

Meta Platforms is a digital advertising giant with deep AI expertise

Meta Platforms owns three of the four most popular social media platforms as measured by monthly active users. That competitive advantage lets it collect consumer data on a tremendous scale, and that data helps brands target ad campaigns. As a result, Meta is the second-largest adtech company worldwide and is likely to gain market share, according to Morningstar.

Meta has already made strides in boosting engagement with artificial intelligence (AI). CEO Mark Zuckerberg told analysts on the second-quarter earnings call, “Advancements in our recommendation systems have improved quality so much that it has led to a 5% increase in time spent on Facebook and 6% on Instagram.” He also said that advertising conversion rates increased across both social media platforms, meaning more clicks and purchases.

Importantly, Meta is investing aggressively in AI infrastructure and aspires to automate the entire ad creation process by next year. The Wall Street Journal writes, “Using the ad tools Meta is developing, a brand could present an image of the product it wants to promote along with a budgetary goal, and AI would create the entire ad, including imagery, video, and text.”

Meta’s Orion smart glasses could be the next big consumer electronics product

Meta Platforms is the market leader in smart glasses, a nascent market where shipments more than tripled last year and are forecast to increase faster than 60% annually through 2029. And Meta is actually gaining market share. Its Ray-Ban smart glasses accounted for nearly three-quarters of shipments in the first half of 2025, up from 60% in 2024.

Counterpoint Research writes, “Ray-Ban Meta smart glasses redefine the smart glasses experience by integrating wearable AI while combining a stylish design with enhanced smart functionalities.” The company sees a large opportunity on the horizon. Zuckerberg believes smart glasses could replace smartphones as the personal computing form factor of choice within the next 15 years.

To capitalize, Meta announced Orion last year, smart glasses that incorporate augmented reality (AR) that overlays the physical world with holographic displays. The company will not commercialize the product for several years while it works to make the technology less expensive. However, smart glasses that blend AR and AI could be revolutionary, as they would enable wearers to search the internet, talk with friends, and watch media content without phones.

Apple rose to great heights following its introduction of the iPhone in 2007. If Zuckerberg is correct about smart glasses being the next big breakthrough in consumer electronics, Meta could become the Apple of the next decade, which means its market value could increase substantially in the years ahead.

Meta Platforms could be a $4.7 billion company by mid-2030

To summarize, Meta has a strong presence in digital advertising and a leadership position in smart glasses. Adtech spending is forecasted to grow at a rate of 14% annually through 2032, while smart glasses sales are projected to increase by more than 60% annually through 2029. In total, that gives Meta a reasonable shot at annual earnings growth of 20%+ in the next five years.

That outlook makes the current valuation of 26.7 times earnings seem quite reasonable. And if Meta does grow earnings at 20% annually over the next five years, its share price could increase by 149% without any change in the price-to-earnings (P/E) ratio. That would bring its market value to $4.7 trillion by mid-2030, surpassing the current combined market value of Nvidia and Palantir.

Trevor Jennewine has positions in Nvidia and Palantir Technologies. The Motley Fool has positions in and recommends Apple, Meta Platforms, Nvidia, and Palantir Technologies. The Motley Fool has a disclosure policy.

Source link

We’re Closing in on the 2nd Priciest Stock Market in 154 Years — and History Offers an Ominous Warning of What Comes Next

When things seem too good to be true on Wall Street, they usually are.

For more than a century, the stock market has stood tall as the premier wealth creator, with stocks generating a higher average annual return than bonds, commodities, and real estate. But getting from Point A to B can often be an adventure.

Just five months ago, the unveiling of President Donald Trump’s tariff and trade policy sent the benchmark S&P 500 (^GSPC -0.64%), growth-fueled Nasdaq Composite (^IXIC -1.15%), and ageless Dow Jones Industrial Average (^DJI -0.20%) spiraling lower. The S&P 500 endured its fifth-steepest two-day percentage decline since 1950, while the Nasdaq Composite plummeted into its first bear market in three years.

However, sentiment on Wall Street can shift at the drop of a hat. Since President Trump announced a 90-day pause on higher “reciprocal tariffs” on April 9, the S&P 500, Nasdaq Composite, and Dow Jones Industrial Average have been off to the races, with all three indexes achieving multiple record-closing highs.

But this euphoria may soon be coming to an end, if history has its say.

A New York Stock Exchange floor trader looking up in bewilderment at a computer monitor.

Image source: Getty Images.

The stock market has rarely been pricier than it is right now

To preface the following discussion, historical precedent can’t concretely guarantee what’s going to happen in the future. If there was a metric or correlative event that could guarantee directional moves in the stock market, every investor would be using it by now.

With this being said, the stock market is making history on the valuation front — and not in a good way.

Value tends to be a subjective term that varies from one individual to the next. What you consider to be expensive might be viewed as a bargain by another investor. This dynamic is one of the reasons the stock market can be so unpredictable.

When most investors “value” a stock, they turn to the time-tested price-to-earnings ratio (P/E), which is arrived at by dividing a company’s share price by its trailing-12-month earnings per share (EPS). The P/E is a quick and easy way to evaluate mature businesses, but it’s not without its faults. This traditional valuation measure doesn’t account for a company’s growth rate, and it can be rather useless during recessions and shock events (e.g., the pandemic).

When back-tested, arguably no valuation tool provides a more-encompassing, apples-to-apples comparison of stock valuations than the S&P 500’s Shiller P/E ratio, which is also referred to as the cyclically adjusted P/E ratio (CAPE ratio).

The Shiller P/E is based on average inflation-adjusted EPS over the trailing decade. This means short-lived recessions and shock events won’t skew valuation multiples.

S&P 500 Shiller CAPE Ratio Chart

S&P 500 Shiller CAPE Ratio data by YCharts.

With the S&P 500 crossing above 6,500 for the first time in its storied history on Aug. 28, the Shiller P/E ratio closed at 39.18, which is its high-water mark for the current S&P 500 bull market. There are only two other periods spanning 154 years when the Shiller P/E has been higher:

  • During the first week of January 2022, the S&P 500’s Shiller P/E surpassed 40 by a few hundredths.
  • In December 1999, the Shiller P/E hit its all-time high of 44.19.

Historical precedent comes into play when examining what has happened to stocks following these previous periods of premium valuations. The 2022 bear market wiped out a quarter of the S&P 500’s value and lopped off more than a third of the Nasdaq’s value.

Meanwhile, the dot-com bubble, which took shape just months after December 1999, saw the S&P 500 and Nasdaq Composite lose 49% and 78%, respectively, on a peak-to-trough basis.

In fact, any instance in which the S&P 500’s Shiller P/E ratio has surpassed and sustained 30 for a period of at least two months has been a harbinger of significant downside. The S&P 500, Dow Jones, and/or Nasdaq Composite lost between 20% and 89% of their value following the five previous occurrences of the Shiller P/E topping 30.

With the stock market closing in on its second-priciest valuation since January 1871, history couldn’t be clearer on what’s to eventually come.

A smiling person reading a financial newspaper while seated at a table in their home.

Image source: Getty Images.

Widening the lens leads to a completely different outlook

But there’s a big difference in attempting to forecast short-term directional moves for Wall Street’s major stock indexes and widening the lens to look at the big picture. While the Shiller P/E has an immaculate track record of forecasting eventual bear market downturns, few (if any) asset classes have proved more resilient over multiple decades than stocks.

The nonlinearity of economic and stock market cycles is one of the most-powerful catalysts working in favor of long-term investors.

For example, approximately 80 years have passed since the end of World War II. Since September 1945, the U.S. has navigated its way through a dozen recessions. The average recession has endured just 10 months, and none of these 12 downturns stuck around for longer than 18 months.

On the other end of the spectrum, the typical period of economic growth has endured for about five years, with two expansions surpassing the 10-year mark. Short-lived downturns and extended periods of growth are favorable to corporate EPS expansion over time.

This disparity between optimism and pessimism is even more apparent in the stock market.

In June 2023, the analysts at Bespoke Investment Group published a data set on X (formerly Twitter) that examined the calendar length of every bull and bear market in the S&P 500 dating back to the start of the Great Depression in 1929.

Bespoke found the average S&P 500 decline of 20% or greater lasted just 286 calendar days, or approximately 9.5 months. But over this nearly 94-year stretch, the typical bull market was sustained for 1,011 calendar days, or two years and nine months.

While it’s anyone’s guess what might happen to stocks a month, six months, or even a year from now, patience and perspective have proved invaluable to investors willing to look to the horizon. The S&P 500 has never been down over any rolling 20-year period, including dividends, which is a strong endorsement for the U.S. economy and stocks in the decades to come.


Source link

Why Cronos Is Skyrocketing This Week

Cronos has doubled over the last week. Can the cryptocurrency keep raging higher?

Cronos (CRO 14.13%) has been one of the hottest gainers in the crypto market over the last week of trading. The company’s share price had risen 100% over the last seven days of trading as of 6:15 p.m. ET Saturday.

Cronos has seen massive gains this week thanks to news that the cryptocurrency will be a key holding for a new crypto-treasury company connected to President Trump that looks poised to launch in the near future. As of this writing, Cronos has a market capitalization of roughly $10.5 billion and ranks as the 17th-largest cryptocurrency by valuation.

A flaming chart arrow moving up.

Image source: Getty Images.

Cronos has seen massive gains following Trump-connected deal

Trump Media announced on Tuesday that it had entered into a partnership that would facilitate the merging of Crypto.com with special purpose acquisition company (SPAC) Yorkville Acquisition to create Trump Media Group CRO Strategy — a new publicly traded company. Cronos is a cryptocurrency launched by Crypto.com, and Trump Media Group CRO Strategy will be purchasing $1 billion worth of the token for its treasury.

Upon completion of the SPAC merger, foundations are place for Trump Media Group CRO to have $200 million in cash and $220 million cash-in mandatory exercise warrants,, and secure a $5 billion credit line. With the new company having access to a large capital base, it’s possible that the large prospective cash pile could be used to purchase more Cronos tokens.

What’s next for Cronos?

The new partnership with Trump-connected companies has been a big bullish catalyst for Cronos and could help push its valuation higher. On the other hand, this doesn’t necessarily guarantee that Cronos will be a strong performer.

For one prominent counterexample, consider the Official Trump cryptocurrency. While the token’s market capitalization surged as high as $5.5 billion shortly after it was launched and endorsed by President Trump on social media, its valuation has now fallen to roughly $1.7 billion. The fact that a crypto-treasury company built around Cronos holdings is seemingly on the horizon may suggest a significantly higher level of institutional support, but it still looks like a high-risk investment.

Keith Noonan has no position in any of the stocks mentioned. The Motley Fool has no position in any of the stocks mentioned. The Motley Fool has a disclosure policy.

Source link

Apple CEO Tim Cook Just Delivered Incredible News for Broadcom Investors

Apple is investing an additional $100 billion into U.S. manufacturing.

Earlier this month, Apple CEO Tim Cook joined President Trump and senior Cabinet members in the Oval Office to announce the company’s plan to invest $100 billion into U.S. manufacturing over the next four years. This comes on top of Apple’s previously unveiled $500 billion domestic infrastructure commitment.

Apple’s ramped-up infrastructure efforts have clear implications for Broadcom‘s (AVGO -3.65%) long-term growth trajectory. As Apple expands its U.S. footprint, Broadcom stands to benefit not only from increased demand for chips but also from its emerging role in powering next-generation networking, connectivity, and artificial intelligence (AI) applications.

Let’s break down why Apple’s continued investment in infrastructure strengthens Broadcom’s strategic position, and how it accelerates the company’s ambitions in AI and beyond.

Broadcom has deep inroads with hyperscalers

While Apple may be one of Broadcom’s most visible partners, the company has also been quietly building deep ties with AI hyperscalers — Alphabet being a notable one.

Broadcom’s portfolio spans custom silicon, networking switches, and optical interconnects — the foundational layers that power modern data centers. These may not be headline-grabbing products, but they serve as the invisible scaffolding that enables AI models to train at scale and keeps data workloads flowing smoothly — avoiding costly compute and connectivity bottlenecks.

What makes Apple’s reliance on Broadcom so compelling is how it bridges two high-growth landscapes: consumer electronics (i.e., semiconductor components for the iPhone) and enterprise-grade AI infrastructure. Broadcom’s established relationships with hyperscalers validate its role as a provider of specialized, mission-critical technologies. Meanwhile, Apple’s endorsement amplifies that credibility — signaling to the broader AI ecosystem that Broadcom is a trusted partner.

In essence, Broadcom is solidifying its influence across the entire technology stack — from chips inside of consumer devices to the infrastructure driving next-generation AI applications inside hyperscale data centers.

Semiconductor chip with

Image source: Getty Images.

Broadcom is a quiet beneficiary of rising AI infrastructure investment

The explosion of AI workloads has only heightened the need for networking gear and the specialized chips that enable big tech to operate at scale. While Broadcom dominates many of these use cases, it rarely commands the same spotlight as Nvidia, Advanced Micro Devices, and Taiwan Semiconductor Manufacturing.

The reason is straightforward: Broadcom isn’t building GPUs that capture headlines. Rather, the company designs the connective tissue that allows GPUs, CPUs, and memory chips to communicate efficiently. Without Broadcom’s technologies, generative AI advancements would remain throttled by data transfer limits and networking bottlenecks.

Is Broadcom stock a buy right now?

While Broadcom lacks the same levels of excitement that have crowned peers like Nvidia as an “AI darling,” this hasn’t translated into a bargain stock price. On the contrary, Broadcom now trades at a forward price-to-earnings (P/E) multiple of 45 — well above its three-year average and essentially at the highest point of the current AI cycle.

AVGO PE Ratio (Forward) Chart

AVGO PE Ratio (Forward) data by YCharts

Broadcom’s premium valuation tells a clear story: The market increasingly views the company as a structural beneficiary of ongoing AI buildouts. Although expectations remain high, Broadcom’s relationships with hyperscalers, as well as its alliance with communications leaders such as Apple help diversify the company’s ecosystem and drive home its broad depth across various applications and use cases.

Unlike Nvidia or AMD, Broadcom does not need to rely on generational product cycles to capture the attention of investors. Instead, the company’s appeal lies in its subtle, less-visible services that keep the digital economy humming along.

This quiet, indispensable nature makes Broadcom less vulnerable to hype-driven volatility while still offering meaningful upside given its exposure to myriad secular trends reshaping the technology landscape.

While the stock isn’t cheap, Broadcom represents a durable infrastructure play as the AI narrative continues to unfold. To me, Broadcom is a compelling opportunity to buy and hold over the long term.

Adam Spatacco has positions in Alphabet, Apple, and Nvidia. The Motley Fool has positions in and recommends Advanced Micro Devices, Alphabet, Apple, Nvidia, and Taiwan Semiconductor Manufacturing. The Motley Fool recommends Broadcom. The Motley Fool has a disclosure policy.

Source link

This Is the Average 401(k) Balance for Retirees Age 60 and Older

A 401(k) is a common type of retirement account that employers offer to their workforce.

The 401(k) account is one of the most common retirement savings accounts that employers offer their workers. Employees are able to contribute pre-tax dollars to these accounts and invest them tax-deferred. Only when withdrawals are made do the account holders pay taxes at their ordinary tax rate.

Employers have the option to offer some kind of matching contribution, usually up to a set percentage of each employee’s salary. Employer contributions are deductible up to a certain point.

With everyone making different salaries and employers having different policies for their 401(k) plans, it’s natural for workers to wonder how much they should save as they approach retirement. While there is no single right answer, available data can help you gauge where you stand.

Person looking at laptop and holding documents.

Image source: Getty Images.

The average 401(k) balance for retirees age 60 and older

While several companies provide data on the average 401(k) balance, I like to use Fidelity when I can, given the company’s size and reputation in the space.

At the end of 2024, Fidelity looked at 401(k) data from 26,700 corporate defined contribution plans that included 24.5 million participants. The company found that the average 401(k) balance was $246,500 for ages 60 to 64, $251,400 for ages 65 to 69, and $250,000 for ages 70 and over.

Fidelity actually recommends saving much more than this amount. In prior articles, the company has suggested having eight times your annual salary by age 60 and 10 times your annual salary by age 67. With median annual earnings for a full-time U.S. worker above $50,000, Fidelity’s recommendation is far higher than the approximately $250,000 average balance for its plan participants near retirement.

But again, there’s always a difference between advice and reality. Retirees should also understand that an average number among tens of millions of people captures so many different scenarios. Ultimately, retirees should think about the lifestyle they want in retirement and work with a financial advisor or on their own to determine how much they need to support that lifestyle.

Source link

“The Swift Effect” Strikes Again: Here’s How the Singer’s Engagement Announcement Impacted Jewelry Stocks This Week

It didn’t turn out to be a “Cruel Summer” for singer Taylor Swift: she and Kansas City Chiefs tight end Travis Kelce, in a continuation of their ongoing “Love Story,” have officially told each other, “You Belong With Me.”

The pop icon, self-made billionaire, and self-described “Anti-Hero” announced her engagement to Kelce in an Instagram post on Tuesday. Sure enough, where there used to be a “Blank Space” on Swift’s ring finger, she was now “Bejeweled” with a large engagement ring (and we hope she doesn’t accidentally “Shake It Off”).

Swift surely knew “All Too Well” that the announcement would make “Sparks Fly” among her legion of fans (to them I say, “You Need to Calm Down”), but even in her “Wildest Dreams,” she probably never expected the news to affect the stock market.

But it did. Here’s how.

Fans at a concert holding up their phones.

Image source: Getty Images.

Look what you made me do…to the market

In the immediate wake of the announcement, as fans were still trying to identify the exact cut of the diamond in Swift’s ring (it was a “cushion cut,” for those who are interested), there was a brief, otherwise-unexplained 1% pop in the stock price of Signet Jewelers Limited (SIG -2.54%), one of the few publicly traded jewelry companies.

As the afternoon wore on, Signet’s shares climbed higher in a rally continued through Wednesday and into Thursday’s premarket trading, when Signet’s stock briefly hit $95/share, up nearly 10% over the pre-“pop star pop” price. The Swift Effect was even more pronounced for Brilliant Earth Group (BRLT 8.55%), which soared from $2.17/share at 12:50 PM on Tuesday to close at $2.82/share, a 30% gain.

Even luxury brands only partially exposed to the jewelry market rose in the wake of the announcement: Movado Group (MOV 2.47%), which is primarily a watchmaker but does sell other jewelry items, and LVMH (LVMHF -1.43%), which owns Tiffany & Co., were both up more than 4% over their pre-engagement price at Thursday’s close.

Today was a fairytale

It’s not the first time that Taylor Swift’s legions of fans — known as “Swifties” — have collectively influenced the financial world. In July 2023, the Federal Reserve’s Beige Book credited Swift’s “Eras” tour as being responsible for the strongest month of hotel revenue in Philadelphia since the pandemic. This mirrored reports from Cincinnati and Chicago, among many other cities, that credited the “Eras” tour for record hotel revenues.

So how did this happen? There was likely a noticeable spike in internet searches for various types of wedding rings in the wake of Swift’s announcement as eager fans tried to identify the exact ring in question (and possibly score one for themselves). That activity may have triggered certain traders’ algorithms to buy jewelry stocks…or perhaps there are just plenty of Swifties among the ranks of hedge fund managers.

The money question is, could this one-time pop in interest translate into a meaningful increase in jewelry sales, or lasting gains for these jewelry stocks?

Is it over now?

Unfortunately, it looks like the rally may already be fizzling. Although Signet Jewelers closed on Thursday at $89.86/share, which is 3.6% above its pre-engagement price, it had fallen significantly from its post-engagement high of $95. Brilliant Earth Group also closed lower on Thursday at $2.69/share, though that was also well above its pre-engagement price.

Getting engaged is a much bigger commitment than buying an album or attending a concert (although the cost of some resold “Eras” tour tickets could have funded an entire wedding and then some). Sure, it might be fun to dream about getting a ring like Taylor Swift, or to shop for one online, but even if you idolize Swift, will her engagement really prompt legions of uncommitted Swifties to propose? (Don’t get me wrong: I know the intensity of Swift’s fandom is strong…but that strong?)

Meanwhile, all of the aforementioned jewelry and jewelry-adjacent companies have significantly lagged the S&P 500 over the past five years: some by a little (Signet is trailing on a total return basis by about 35 percentage points) to a lot (Brilliant Earth is “Down Bad,” by a jaw-dropping 130 percentage points).

I’d classify those returns as not just in the “Red,” but redder than “Bad Blood,” and it’ll take more than a one-time surge of interest from Swifties to make me say anything besides “I Knew You Were Trouble” and “We Are Never Ever Getting Together.”

That said, whichever jeweler can be the first to mass-produce a Taylor Swift-inspired cushion-cut engagement ring will almost certainly have a hit on their hands.

Source link

Will 2025’s 3 Best-Performing “Ten Titans” Stocks Lead the Group Again in 2026?

Oracle, Netflix, and Nvidia are up more than 35% year to date, adding to their outsized gains in recent years.

The 10 largest growth-focused U.S. companies now make up 38% of the S&P 500. Known as the “Ten Titans,” the list includes Nvidia (NVDA -3.38%), Microsoft, Apple, Amazon, Alphabet, Meta Platforms, Broadcom, Tesla, Oracle (ORCL -5.97%), and Netflix (NFLX -1.87%).

Oracle, Netflix, and Nvidia have been the best performers of the Titans year to date. Let’s determine if these growth stocks have what it takes to continue outperforming next year.

A person smiles while sitting in front of a laptop computer.

Image source: Getty Images.

Oracle has innovative ideas, but they come at a price

Oracle has been the standout among the Titans. With a year-to-date total return of more than 40%, it vaulted its market cap above $660 billion.

ORCL Total Return Level Chart
ORCL Total Return Level data by YCharts.

Oracle was close to dead money in the five years between 2015 and the end of 2019 — gaining just 17.8% compared to 56.9% for the S&P 500. But since the start of 2020, Oracle is up 345% compared to a 100.6% gain in the S&P 500. A big driver of the outperformance is the build-out and adoption of Oracle Cloud Infrastructure (OCI).

Oracle transformed from a database-first company to a fully fledged ecosystem. Not long ago, companies were using Oracle’s database software on third-party clouds. Oracle decided to capture that revenue by building out its own cloud services.

Oracle Integration Cloud hosts software-as-a-service offerings for financial reporting, automated workflows, human resources operations, marketing, personalization, and more. Oracle also offers artificial intelligence (AI)-powered database services. And OCI has been shown to be much more cost-effective for data-intensive operations than Amazon Web Services, Microsoft Azure, or Google Cloud. It’s an especially ideal offering for industries like financial services and healthcare that have complex regulatory frameworks and sensitive information. On its earnings calls, Oracle often discusses how industries are choosing OCI for its security and compliance capabilities.

Oracle was already a leader in enterprise software solutions. And now, it is a major player in the cloud business. The main downside of Oracle is that its valuation is expensive, and it is spending extremely aggressively. Oracle is arguably among the higher-risk, higher-potential-reward Titans. If its investments translate to bottom-line earnings growth, it could continue to be one of the best performers in the group. If not, it wouldn’t be surprising if the stock underwent a sizable sell-off.

Netflix is an entertainment giant that is raking in the cash flow

Netflix’s outsized returns in recent years are partly due to how beaten down the stock was going into 2023. Netflix fell over 50% in 2022, outpacing the broader sell-off in the Nasdaq Composite (NASDAQINDEX: ^IXIC) that year. At the time, other streaming platforms were gaining traction, and Netflix was still inconsistently profitable.

The business model has remained largely unchanged over the past decade. So it’s not a transformational story like Oracle. Rather, Netflix has perfected its craft.

The biggest change has been its content slate — what it spends on, how it markets that content (like the global success of “KPop Demon Hunters,”) and basically just boosting its overall content success rate. The second major change was cracking down on password sharing. This was a resounding success because a lot of new accounts opened up — showing that customers were willing to pay for Netflix because they value the service (again, despite a lot of competition). And finally, Netflix’s ad-supported tier is driving new signups, which accelerates revenue growth.

Netflix is an industry-leading cash cow with high margins. It has become a near-perfect business. The only issue is that the valuation reflects that, as Netflix trades at 52 times trailing 12-month earnings. Netflix could still be a winning long-term stock, but it may need a year or two to grow into its valuation. Therefore, it may not be a standout performer in 2026.

Nvidia just delivered another blowout quarter

Nvidia reported exceptional second-quarter fiscal 2026 results on Aug. 27 despite the company’s China business being hindered by export restrictions to China.

Even with difficult comps from the second-quarter fiscal 2025, Nvidia grew revenue by 56% and adjusted earnings per share by 54%. Arguably, the most impressive aspect of Nvidia’s results is that it continues to sustain ultra-high gross margins over 70%. Nvidia’s high margins allow it to convert a substantial amount of sales into profit, which is a testament to its edge over the competition and technological leadership on the global stage.

Nvidia gets a lot of attention for its data center business — and rightfully so, as it made up 88% of revenue in the recent quarter. But it’s worth noting that the rest of the business is doing well too. Nvidia’s non-data center revenue, which includes gaming and AI PC professional visualization, automotive, and robotics, was collectively $5.49 billion — up 48% compared to $3.7 billion a year ago.

Nvidia is in its third year of what has been an uninterrupted masterclass of exponential growth on a scale unlike any business the world has ever seen. And somehow, the company still has its foot on the gas with no signs of slowing down.

Nvidia’s outlook for the third-quarter fiscal 2026 calls for $54 billion in revenue even if it ships zero H20 chips to China — all while maintaining a 73% gross margin. That would mark a 54% increase in revenue and just slightly lower gross margins than third-quarter fiscal 2025 and a near three-fold increase in revenue in just two years.

Despite the impeccable results, Nvidia’s valuation isn’t cheap, as investors are pricing in a sustained breakneck growth rate. But Nvidia just keeps delivering, so its 58.4 price-to-earnings ratio is reasonable.

If Nvidia’s stock price remained unchanged for a year but the company grew earnings by 50%, the P/E would drop to 38.9. So even now, with the stock on track to crush the S&P 500 for the third consecutive year, Nvidia remains a top AI stock to buy now.

I expect Nvidia to continue leading the Ten Titans higher in 2026, especially if trade policy with China eases. However, if for whatever reason there’s a slowdown in AI spending from key Nvidia customers, Nvidia could drag down the Ten Titans and the broader market with it.

Daniel Foelber has positions in Nvidia. The Motley Fool has positions in and recommends Alphabet, Amazon, Apple, Meta Platforms, Microsoft, Netflix, Nvidia, Oracle, and Tesla. The Motley Fool recommends Broadcom and recommends the following options: long January 2026 $395 calls on Microsoft and short January 2026 $405 calls on Microsoft. The Motley Fool has a disclosure policy.

Source link

Is Rigetti Computing Stock a Buy Now?

The company’s newest quantum computer is the largest multichip machine in the industry.

Rigetti Computing (RGTI -2.14%) is among the stocks benefiting from investor interest in the quantum computing field. The company’s shares are up over 1,500% in the past 12 months through Aug. 27.

Rigetti and other businesses in the sector are developing technology with the potential to transform industries, including medicine and artificial intelligence. Because quantum computers are powered by atomic particles, they boast computational capabilities beyond the reach of current classical computers.

However, they also have shortcomings that hinder their widespread adoption. One key drawback is that errors creep into quantum computations due to the extreme difficulty of isolating and controlling quantum states. While quantum computing is inherently probabilistic (which is actually useful for many algorithms that rely on randomness), the real challenge is that environmental noise and imperfect controls corrupt these probabilities. Finding and correcting these errors — distinguishing between intended quantum randomness and unwanted noise — is one of the field’s key issues.

Can Rigetti’s tech overcome such challenges? Discovering the answer requires diving into the company in more detail.

A close up of an activated quantum computer with a glowing center between wires and plating.

Image source: Getty Images.

Rigetti’s technological prowess

Rigetti’s technology employs superconducting qubits, a widely used approach to quantum computing due to its advantages. This method performs faster than other quantum techniques and leverages existing semiconductor chip fabrication processes, which helps to scale up the technology.

In recent weeks, Rigetti unveiled its latest invention, the Cepheus-1-36Q. This multi-chip quantum machine is the largest in the industry, according to the company. Moreover, the device’s calculation error rate is half that of its predecessor.

The Cepheus-1-36Q shows Rigetti is making progress toward overcoming the issues inherent in quantum computers. Despite that, the company isn’t growing sales this year. In the second quarter, Rigetti generated $1.8 million in revenue, which was down from $3.1 million in 2024.

A look into Rigetti’s financials

While the company has struggled to produce revenue, its costs are climbing. Rigetti’s Q2 cost of revenue and operating expenses both ticked up from 2024, resulting in an operating loss of $19.9 million versus a loss of $16.1 million in the previous year.

The costly combination of rising expenses and declining sales is cause for concern. Rigetti’s saving grace is that it amassed an impressive $571.6 million in cash, cash equivalents, and available-for-sale investments with no debt on its balance sheet. The funds can sustain operations in the short term as the company builds up income.

The quest to increase sales relies on how quickly Rigetti’s tech can achieve quantum advantage. This is the point at which a quantum device can solve useful, real-world problems more effectively than classical computers.

According to CEO Dr. Subodh Kulkarni, Rigetti is about four years away from achieving quantum advantage. In the meantime, it’s cobbling revenue together from organizations interested in quantum computing for research and experimentation, such as its collaboration with Montana State University announced on Aug. 20.

Factors to consider before deciding on Rigetti stock

At this early stage in quantum computing’s development, Rigetti’s future depends on reaching quantum advantage as fast as possible. Once there, it can unlock more sales as its technology becomes a superior alternative to classical supercomputers.

Can Rigetti achieve this goal in four years? Its shares are trading as if that’s likely.

Here’s a look at the stock’s valuation using the price-to-sales (P/S) ratio, and contrasting it to other pure-play quantum computing competitors IonQ and D-Wave Quantum. This metric measures how much investors are willing to pay for every dollar of revenue generated over the trailing 12 months.

RGTI PS Ratio Chart

Data by YCharts.

Rigetti’s P/S multiple is sky-high compared to its rivals, indicating that shares are expensive. Perhaps investors are betting the company can achieve quantum advantage.

But a lot can happen in four years, and if Rigetti continues to burn through cash with little revenue trickling in, the business may not survive to achieve its goal.

In addition, many well-heeled competitors, including Alphabet-owned Google, are actively pursuing quantum advantage. Google has already developed a quantum chip capable of completing a complex computation in five minutes that would take centuries with today’s fastest supercomputers. Granted, this algorithm is a benchmark designed to be easy for quantum computers and hard for digital system, but it’s still an impressive achievement.

Although it’s too early to tell which business will deliver the dominant technology, one or more of these rivals could build a scalable quantum computer that overcomes the obstacles to broad adoption. This competition impacts Rigetti’s ability to attract customers, as evidenced by its difficulties with revenue growth.

Consequently, only investors with a high risk tolerance should consider buying Rigetti shares. Even then, given its stock’s inflated valuation, the ideal approach is to wait for the share price to drop before deciding to invest.

Source link

New Motley Fool Research Reveals the 10 Largest Consumer Staple Companies. Here’s Which Dividend King Is Still Flying Under the Radar.

Consumer staples makers are generally considered resilient businesses, but even Dividend Kings fall out of favor sometimes.

The Motley Fool just updated its report on the 10 largest consumer staple companies. You probably know every name on the list, which includes retail giants like Walmart (NYSE: WMT), product makers like Procter & Gamble (NYSE: PG), and tobacco companies like Philip Morris International (NYSE: PM). Also on that list is a Dividend King food and beverage company that has a historically high yield. Here’s why it could be the best opportunity for investors today.

What does PepsiCo do?

To get right to the crux of the topic, PepsiCo (PEP 1.12%) is the company in question. It sits at No. 7 on the list of the largest consumer staple companies, with a market cap of around $200 billion. It is one of three beverage makers on the list, the other two being Coca-Cola (KO 0.94%) at No. 4 and Anheuser-Busch InBev (NYSE: BUD) at No. 10.

Hands holding blocks spelling risk and reward.

Image source: Getty Images.

Unlike those other two, however, PepsiCo’s business extends well beyond beverages. It also has leading positions in the salty snack (Frito-Lay) and packaged food (Quaker Oats) segments of the sector. It is one of the most diversified companies on the top-10 list. Only Unilever (NYSE: UL), which makes household products and food, has a similar degree of diversification.

PepsiCo, meanwhile, stands toe to toe with every company on the list with regard to name recognition. For more direct peers, those that manage brands and are not retailers, it can compete equally on distribution, marketing, and product development. And, like all the other names on the list, PepsiCo is large enough to act as an industry consolidator, buying smaller companies to round out its brand portfolio and keep up with consumers’ buying habits.

The proof of the business’s strength and resilience is best highlighted by the fact that PepsiCo is a Dividend King. It has increased its dividend annually for 53 consecutive years, which is not something a company can achieve if it doesn’t have a strong business model that gets executed well in both good times and bad. For reference, other Dividend Kings on the list include Walmart, Coca-Cola, and Procter & Gamble.

WMT Chart
WMT data by YCharts.

This is not a good time for PepsiCo 

Among the sub-grouping of large consumer staples companies that are also Dividend Kings, PepsiCo has been the laggard in recent years. To put a number on that, PepsiCo’s 2.1% organic sales growth in the second quarter was less than half the 5% growth of Coca-Cola, its closest peer. No wonder PepsiCo’s stock is down more than 20% from its 2023 highs, the worst result from the Dividend Kings grouping. That also puts PepsiCo into its own personal bear market.

However, the market’s negative view of PepsiCo could be an opportunity for long-term dividend investors. For starters, history suggests that PepsiCo will muddle through this rough patch, as it has done many times before. Second, the company is already making moves to improve performance, including buying a Mexican-American food maker and a probiotic beverage company. Third, falling share price has pushed its dividend yield up to 3.8%, which is toward the high end of the stock’s historical yield range.

That last point suggests that PepsiCo stock is cheap right now. This view is backed up by the fact that the company’s price-to-sales and price-to-book-value ratios are both well below their five-year averages. The company’s price-to-earnings ratio is sitting around the longer-term average. This is an opportunity if you think in decades and not days.

The time to jump is now

The interesting thing here is that PepsiCo is actually the best-performing stock on the top 10 list over the past three months. It seems investors are beginning to recognize the potential. But given how far the stock has fallen, it is still flying under the radar a bit. If you like owning Dividend Kings with reliable businesses, PepsiCo can still be an attractive long-term investment to add to your portfolio… if you act quickly.

Reuben Gregg Brewer has positions in PepsiCo, Procter & Gamble, and Unilever. The Motley Fool has positions in and recommends Walmart. The Motley Fool recommends Philip Morris International and Unilever. The Motley Fool has a disclosure policy.

Source link

Down 50%, Should You Buy the Dip on C3.ai?

C3.ai recently delivered shocking guidance that drained investor confidence in the stock.

This has turned out to be a terrible year for C3.ai (AI -2.37%) investors so far, as shares of the pure-play enterprise artificial intelligence (AI) software solutions provider have dropped 50% in 2025 as of this writing. The stock had been gaining momentum in recent months but was hammered earlier in August following the release of its preliminary results.

C3.ai stock lost over a quarter of its value in a single day after the company announced its preliminary fiscal 2026 first-quarter results (for the three months ended July 31) on Aug. 9. Let’s see why investors pressed the panic button and find out if it is worth buying the stock following its big pullback.

Person with folded hands looking at a computer screen.

Image source: Getty Images.

C3.ai’s alarming fiscal Q1 performance

C3.ai provides an AI software platform that allows enterprise and federal customers to build and deploy custom AI applications and AI agents. The company has been able to expand its customer base at a nice pace in recent quarters, indicating that it was on the right track to capitalize on the huge addressable opportunity in enterprise AI software.

That’s why C3.ai’s preliminary results shocked investors. The company says its revenue last quarter stood at just over $70 million, well below the guidance range of $100 million to $109 million. The non-GAAP (adjusted) loss from operations was just below $58 million, which was more than double its original expectation.

C3.ai reported $87 million in revenue in the year-ago period and its non-GAAP operating loss stood at $16.6 million. So, the company is definitely not going in the right direction despite operating in a thriving market. But you may be wondering why C3.ai’s growth trajectory — which had been gaining momentum — has collapsed all of a sudden.

AI Revenue (Quarterly) Chart

AI Revenue (Quarterly) data by YCharts

C3.ai CEO Thomas Siebel points out that there are two reasons why this is the case. First, C3.ai’s organizational restructuring by bringing in new leadership has had a “disruptive effect.” Second, the CEO’s health issues kept him from taking part in the sales process, and Siebel points out his absence “may have had a greater impact” than anticipated on the company’s performance.

The company is now hunting for a new CEO. There is a good chance that this transition could weigh on its performance in the near term as it tries to navigate an organizational restructuring while the new leadership settles in. A number of new leaders have joined C3.ai of late and it may take some time for them to get used to the way the company works and deliver fruitful results.

What should investors do?

The near-term uncertainty makes C3.ai a risky bet right now. Of course, the company points out that it has “completely restructured the sales and services organization” and is trying to “return to accelerating growth and increased customer success,” but it would be better if investors wait for tangible signs of a turnaround.

The good part is that C3.ai announced a new contract with Brazil’s Eletrobras just recently, apart from launching new agentic AI solutions. These moves could help the company steady the ship in the future, but the reality right now is that analysts have significantly reduced their growth expectations.

AI Revenue Estimates for Current Fiscal Year Chart

AI Revenue Estimates for Current Fiscal Year data by YCharts

Moreover, the company’s expanding losses are another cause for concern. As such, investors would do well to stay away from C3.ai right now, though it may make sense to keep this AI stock on the watch list. C3.ai is serving a fast-growing AI software market that’s expected to grow at a compound annual rate of 25% through 2030, and any positive developments in its operations could bring the stock back into the good graces of investors.

Source link

3 Magnificent Stocks to Buy in September

These companies can help strengthen your long-term portfolio.

The stock market makes it easy to build wealth. All you have to do is invest in strong businesses that are growing and profitable. Choosing top stocks from among brands or services you use regularly is a great place to start.

To give you some ideas, three Fool.com contributors are here to offer three timely stocks to buy in September. Here’s why they chose Apple (AAPL -0.19%), Airbnb (ABNB -0.01%), and RH (RH -1.55%).

A stock chart with a city skyline and dollar bills in the background.

Image source: Getty Images.

1. Apple still has an ace up its sleeve

John Ballard (Apple): Shares of Apple are up 40% over the past three years but are currently trading below their 52-week high of $260. Apple has a tremendous competitive moat around its ecosystem of products and services that locks in customers and generates enormous profits. While flat iPhone sales and the lack of a compelling artificial intelligence (AI) strategy has created uncertainty for investors, the recent dip is a good buying opportunity.

Apple is one of the strongest consumer brands. Its installed base of active devices, including iPhones, continues to hit all-time highs. Apple reported more than 2.35 billion active devices at the beginning of the year. This continues to fuel steady growth in services, including subscriptions and app purchases, which now make up more than a quarter of Apple’s revenue.

While Apple Intelligence has had a positive impact on iPhone 16 sales, it hasn’t been the game-changer investors were expecting. For a company that generates $96 billion in free cash flow and has massive cash resources on its balance sheet, Apple has surprisingly missed the boat on building its own proprietary AI models. But the good news is that Apple’s enormous cash resources will allow it to catch up quickly through acquisitions, which is a catalyst to watch.

Apple’s sticky ecosystem of products and services, growing installed base of devices, and profitability make the stock a solid investment. These advantages buy some time for Apple to figure out its AI strategy, providing investors a good opportunity to buy shares before better news sends the shares higher.

2. This travel powerhouse is thriving, but its stock isn’t keeping up

Jennifer Saibil (Airbnb): Airbnb stock has not kept up with its growth, but as it continues to expand and increase sales, it looks poised to soar.

Airbnb has become the premier platform for vacation rentals, changing the landscape of the travel industry. While short-term rentals are its bread and butter, it offers a large assortment of services today, including longer-term stays and even living in Airbnbs.

It had already launched an entire segment devoted to experiences, which dovetails with its travel categories, and recently launched a new segment with all kinds of services, like salons and photography. Each of these new features increases its addressable market and its brand presence, making it the go-to name for travel-related services.

That’s important to maintain its growth levels. Revenue growth has slowed, but it remains in the double digits, and revenue increased 13% year over year in the second quarter. Aside from the expansion, Airbnb is constantly adding new features and updates to improve the user experience and generate higher engagement and sales. Some of its updates include more flexible payments and a more fine-tuned search system, which makes it easier for customers to press the button.

It’s also been building its brand in countries where it has plenty of rentals but lower name recognition. Just as many travelers use it domestically in the U.S., it’s trying to make that happen in other regions.

It’s done a spectacular job of generating free cash flow, which reached $1 billion in the second quarter at a 31% margin, and it’s also highly profitable, with a 21% profit margin in the quarter.

The market has been disappointed in Airbnb’s decelerating growth, and it has been concerned about regulatory hurdles. But Airbnb continues to thrive as a business, and its stock should eventually follow suit.

3. Housing stocks are coming back

Jeremy Bowman (RH): It’s been a rough few years for RH, the home furnishing company formerly known as Restoration Hardware, but a number of tailwinds appear to be forming for the company.

First, after a long wait, the Federal Reserve appears to be ready to lower interest rates following Jerome Powell’s comments at the Jackson Hole conference, and RH is likely to be one of the beneficiaries.

The company’s business is correlated with the housing market, as home sales tend to trigger purchases of home furnishings. Even in a challenging housing market, RH has delivered solid results, returning to growth after an earlier lull as revenue rose by 12% in the first quarter.

Additionally, the company is expanding both geographically and into new businesses. It’s opening up several galleries across Europe, and has launched new verticals, including a handful of guesthouses and restaurants, and leasing charter jets and yachts. That’s all part of a strategy to extend the luxury brand beyond home furnishings, and it could significantly expand RH’s addressable market.

The stock is still down significantly from its all-time high, and looks cheap based on forward estimates, trading at just around 15 times next year’s expected earnings.

The company is set to report second-quarter earnings on Sept. 11, and better-than-expected results could spark a surge in the stock, and a rate cut from the Federal Reserve later in the month could do the same.

Over the longer term, RH has a lot of upside, especially if the housing market recovers.

Source link

Huge News for Qualcomm Investors

Qualcomm (NASDAQ: QCOM) is no longer just a smartphone chipmaker — it’s expanding into AI, automotive, and IoT with bold acquisitions like Alphawave. With analysts seeing 41% upside, Qualcomm may be one of the most overlooked growth and dividend plays today.

Stock prices used were the market prices of Aug. 26, 2025. The video was published on Aug. 29, 2025.

Where to invest $1,000 right now? Our analyst team just revealed what they believe are the 10 best stocks to buy right now. Continue »

Should you invest $1,000 in Qualcomm right now?

Before you buy stock in Qualcomm, consider this:

The Motley Fool Stock Advisor analyst team just identified what they believe are the 10 best stocks for investors to buy now… and Qualcomm wasn’t one of them. The 10 stocks that made the cut could produce monster returns in the coming years.

Consider when Netflix made this list on December 17, 2004… if you invested $1,000 at the time of our recommendation, you’d have $664,110!* Or when Nvidia made this list on April 15, 2005… if you invested $1,000 at the time of our recommendation, you’d have $1,104,355!*

Now, it’s worth noting Stock Advisor’s total average return is 1,069% — a market-crushing outperformance compared to 186% for the S&P 500. Don’t miss out on the latest top 10 list, available when you join Stock Advisor.

See the 10 stocks »

*Stock Advisor returns as of August 25, 2025

Rick Orford has positions in Apple. The Motley Fool has positions in and recommends Apple and Qualcomm. The Motley Fool has a disclosure policyRick Orford is an affiliate of The Motley Fool and may be compensated for promoting its services. If you choose to subscribe through their link, they will earn some extra money that supports their channel. Their opinions remain their own and are unaffected by The Motley Fool.

Source link