money

2 Top Artificial Intelligence (AI) Stocks to Buy With $1,000 Right Now

IBM is already thriving in the artificial intelligence (AI) industry, and Intel could be a major player down the road.

The artificial intelligence (AI) industry is evolving rapidly. AI is getting smarter, although some cracks in the growth story have emerged. OpenAI‘s highly anticipated GPT-5 model has fallen well short of inflated expectations, which likely throws some cold water on the idea that AI “superintelligence” is right around the corner.

While uncertainty is running high, International Business Machines (IBM -0.85%) and Intel (INTC -0.59%) are two AI stocks worth buying if you have $1,000 available to invest. IBM is focusing on applying AI to real-world problems for its clients, and Intel could find itself manufacturing future AI chips for third-party customers if it can get its act together.

Here’s why IBM and Intel both look like solid AI bets.

An AI graphic in a magnifying glass.

Image source: Getty Images.

IBM: Using AI in the real world

Right now, companies like Nvidia that supply the powerful GPUs that make the AI boom possible are raking in most of the cash. In the long run, though, companies that take AI technology and provide high-value services will likely be the big winners. IBM is already doing exactly that.

An astonishing 95% of AI pilots at companies fail to produce results, according to an MIT report. With many businesses struggling to implement AI in a way that actually increases revenue or reduces costs, IBM already offers a solution. The company’s generative AI business has drummed up $7.5 billion worth of business so far, with most of that total coming from its consulting arm. AI implementation and integration services are proving to be critical pieces of the puzzle for enterprises.

As companies shift from frantically deploying AI to really thinking about returns on investment and real-world results, IBM is in a great position to grow its generative AI business. With the global economic environment growing more uncertain, AI projects that promise reduced costs and greater efficiency should be in high demand.

That’s exactly what IBM supplies. By pairing consulting with software, IBM has found a lucrative AI niche that can drive growth for years to come.

Intel: The foundry opportunity

There’s no question that Intel has largely failed to take advantage of the AI boom so far. The company’s AI accelerator efforts have been a disaster, with its Gaudi AI chips selling poorly and its next-generation Falcon Shores cancelled. New CEO Lip-Bu Tan has noted that it may be too late for Intel to succeed in the AI training market, which is dominated by Nvidia.

While Intel may not be a major player in the AI accelerator market, the future is likely to be less concentrated. Nvidia still sells the lion’s share of powerful AI chips, but many tech giants are already designing custom AI chips of their own, particularly for AI inference workloads. Reducing the costs associated with running powerful AI models is critical for companies like Alphabet, which is integrating AI into its core search business.

This explosion of custom AI chips could be a boon for Intel if the company can get its act together in the semiconductor foundry business. While the Intel 18A process is ready for volume manufacturing, the company has failed to win a major external customer. Intel 14A, which is expected to be ready in 2027, may be the company’s last shot at making the foundry business work.

If Intel can sell AI chip designers on its Intel 14A process, the company could turn its money-losing foundry bet into a highly profitable endeavor. The U.S. government’s stake in Intel could provide some incentive for companies to choose Intel for manufacturing, given the Trump administration’s push to boost U.S. semiconductor manufacturing. Even a single large customer win for Intel’s foundry could send the stock soaring as it finally taps into the booming AI chip market.

Timothy Green has positions in Intel and International Business Machines. The Motley Fool has positions in and recommends Alphabet, Intel, International Business Machines, and Nvidia. The Motley Fool recommends the following options: short August 2025 $24 calls on Intel and short November 2025 $21 puts on Intel. The Motley Fool has a disclosure policy.

Source link

3 Top Dividend Stocks to Buy in September

If you are looking for high yields in September, this trio of industry-leading dividend stocks is going to be right up your alley.

As the month of September gets underway, dividend investors looking for new opportunities shouldn’t be put off by the lofty levels of the broader market. Sure, the S&P 500 index (^GSPC -0.69%) is near all-time highs, but there are still some very attractive high-yield stocks hiding under the surface.

Three of the most attractive buys right now in the energy sector could be NextEra Energy (NEE 0.79%), Chevron (CVX 0.77%), and Enterprise Products Partners (EPD -0.45%). Here’s why.

Three golden eggs in a basket made of money.

Image source: Getty Images.

1. NextEra Energy has an attractive yield, relatively speaking

The S&P 500 index’s dividend yield is a miserly 1.2% or so. Utility NextEra Energy’s dividend yield is more than twice as high, at 3.1% or so. The average utility, meanwhile, has a yield of roughly 2.7%. So, while NextEra Energy’s yield may not be as high as some investors might like, it is still a very attractive yield compared to relevant benchmarks.

That said, the really exciting story here is the dividend growth. During the past decade, NextEra’s dividend has increased at a 10% annualized clip. That’s good for any company, but particularly good as the utility sector is known for more for slow and steady growth. NextEra expects to raise the dividend by 10% a year through at least 2026. The 6% to 8% earnings growth that is backing the dividend increases is expected to last through at least 2027. In other words, strong dividend growth is likely to continue beyond the current projection.

Two things are driving that growth. First is the company’s core regulated electric utility operations in Florida. This state has benefited for years from in-migration. More residents means more customers and more demand. But NextEra has a second business in the mix, since it is also one of the world’s largest solar and wind companies. This division is the growth driver and given the energy transition going on, it will likely remain a growth driver for years to come. If you like growth and income stocks, high-yield NextEra Energy should be on your list in September.

2. Chevron has a high yield and a resilient business

Integrated energy giant Chevron’s dividend yield is about 4.3%. The average energy stock’s yield is roughly 3.3%. Like NextEra, Chevron looks like a dividend stock with a relatively attractive yield. It surpasses the 4% yield mark that many dividend investors use when looking for investments. So it might be more tempting than NextEra Energy.

Adding to the attraction here is the fact that Chevron has increased its dividend for 38 consecutive years. This is despite the fact that Chevron operates in the commodity-driven energy sector, where oil prices have a huge impact on financial performance. Using an integrated model, which provides exposure to the entire energy value chain, and a focus on a strong balance sheet, with a low debt-to-equity ratio of 0.2, both help Chevron keep the dividend growing. Basically, its business is resilient to the industry’s typical swings.

But the real linchpin here is the fact that Chevron’s business foundation is getting stronger. First, after a long and difficult effort, the company’s troubled acquisition of Hess has been completed. That’s good for growth. And second, the company’s Venezuelan operations, which can be a bit of a political headache, are starting to function more normally again. This high-yield and reliable energy business is finally working from a position of strength again.

3. Enterprise Products Partners is a tortoise with an ultra-high yield

Master limited partnership (MLP) Enterprise Products Partners’ distribution yield is a mighty 6.8%. And the distribution has been increased for 27 consecutive years. That combination will probably be appealing to most dividend investors.

Enterprise’s business is built from the ground up to support its distributions. It has an investment-grade rated balance sheet. And its energy business is squarely in the midstream, where a toll-taker model is used. Enterprise owns vital energy infrastructure assets, like pipelines, for which it charges usage fees. Those fees are tied to volume, not energy prices, making cash flows fairly reliable through the energy cycle.

That said, there is one potential problem. While NextEra is known for being a dividend-growth hare, Enterprise is known for being a distribution-growth tortoise. Slow and steady distribution growth is likely the best you can expect, but given the lofty starting yield, that probably won’t upset dividend investors looking to maximize the income they generate today.

Plenty of great options for dividend investors

The S&P 500 index is a top-level view of the market and frequently, one that is driven by a small number of large companies. There are always plenty of attractive dividend stocks hidden under the surface. Right now some of the best might be NextEra, Chevron, and Enterprise Products Partners. As September gets underway, you should probably take the time to get to know each one of these energy stocks.

Reuben Gregg Brewer has no position in any of the stocks mentioned. The Motley Fool has positions in and recommends Chevron and NextEra Energy. The Motley Fool recommends Enterprise Products Partners. The Motley Fool has a disclosure policy.

Source link

Sluggish Sales and a Change in CEO: Is Target’s Stock Destined to Go Lower?

Target’s stock is currently trading around multi-year lows.

This year has been a tough one for many retailers, with global tariffs and trade wars raising costs and creating plenty of uncertainty. Consumers, meanwhile, have been cutting back on discretionary spending as they look to tighten up their budgets.

One retailer that has felt the effects of this in a significant way is Target (TGT -3.60%), whose sales have been stagnant. And over the past 12 months, its valuation nosedived by 37%. Its performance has been so bad that the stock is trading around the levels it fell to during the brief market crash in 2020.

The trouble is, it may not necessarily be due for a rally just yet, even despite its beaten-down valuation. And the company recently announced a new CEO, which investors and analysts aren’t convinced will rectify the situation. Could Target’s stock be headed for even more of a decline in the future, or is it a worthwhile contrarian pick to add to your portfolio today?

Concerned person looking at a piece of paper.

Image source: Getty Images.

Investors worry an internal hire may be a mistake for Target

On Aug. 20, Target announced that Michael Fiddelke will take over as CEO of the company on Feb. 1, 2026. Current CEO Brian Cornell is stepping down but will be on the company’s board of directors. Cornell says that Fiddelke, who is currently Target’s chief operating officer and who has been with the company for 20 years, is the best-suited person to lead the company’s turnaround efforts.

The words of confidence, however, didn’t seem to have much of an effect on investors, with shares of Target declining after the news. Investors may have been hoping for a more aggressive effort to turn the business around, similar to Starbucks‘ move to grab high-profile executive Brian Niccol a year ago, who came over from Chipotle Mexican Grill. While that hasn’t paid off for Starbucks just yet, the Niccol hire has been seen as a bold move for the struggling coffee chain to help make significant changes necessary to improve its operations.

The danger with an internal hire, particularly of an existing executive, is that it might mean more of the status quo for the business, and a continuation of a process and strategy that hasn’t been working. Target’s results have been lackluster of late, and significant changes may be needed to get investors bullish on the retail stock.

Target has been struggling to grow its sales in recent years

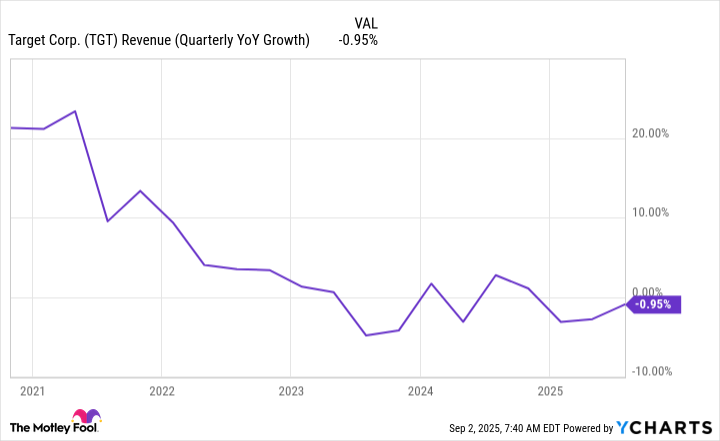
The problem for Target may be more to do with macroeconomic conditions rather than poor management decisions. As consumers are scaling back on discretionary spending, many retailers have been struggling to generate any growth. Target’s lackluster sales growth has been going on for a couple of years now, coinciding with rising interest rates, which have increased costs for consumers and businesses alike.

TGT Revenue (Quarterly YoY Growth) Chart

TGT Revenue (Quarterly YoY Growth) data by YCharts

In Target’s most recent quarter, which ended Aug. 2, the company’s net sales totaled $25.2 billion and were down 0.9% year over year. And with costs still rising, its operating income fell by more than 19%, to $1.3 billion. For the full fiscal year, which ends in January, Target continues to expect a low-single digit drop on the top line.

For Fiddelke, it won’t be an easy task to fix Target’s problems given that they may be stemming from economic factors. Even if he were to make drastic changes, they could be costly, at a time when it may be more important for the business to trim expenses rather than to experiment with store designs or product mix. Weathering the storm may be the key at this point for Target.

Target’s business isn’t broken, but investors will need patience with the stock

Target is facing some tough times right now, but I don’t believe the business is in awful shape and that it needs significant changes. It wasn’t all that long ago, during the pandemic, when sales were soaring as consumers had an excess of discretionary income at their disposal. Now, however, as that situation has changed, the reverse is happening and sales aren’t looking so strong anymore.

For long-term investors who can afford to be patient with the stock, Target may be worth investing in today, even though it may still go lower in the short term. It trades at a price-to-earnings multiple of 11, which is incredibly cheap when you consider the S&P 500 average is 25. It may take some time for the stock to turn things around, but Target also offers a compelling 4.7% dividend yield that can compensate you for your patience.

David Jagielski has no position in any of the stocks mentioned. The Motley Fool has positions in and recommends Chipotle Mexican Grill, Starbucks, and Target. The Motley Fool recommends the following options: short September 2025 $60 calls on Chipotle Mexican Grill. The Motley Fool has a disclosure policy.

Source link

Investors Bought the XRP Hype — Is It Now Time to Sell the News?

With the most-anticipated event for XRP now in the rearview mirror, it may be difficult for the world’s No. 3 digital asset to sustain its parabolic climb.

Over the past century, no asset class has rivaled the annualized return of stocks. But when the lens is narrowed to just the trailing decade, cryptocurrencies have absolutely crushed the benchmark S&P 500 in the annualized return column.

Though Bitcoin (BTC 0.46%) has led the way with its first-mover advantages, it’s XRP (XRP 0.56%) that’s been flying the highest of all the major digital assets of late. Over the trailing-12-month period, XRP has practically quintupled, up 396%, while Bitcoin has gained a more “modest” 84%, as of the late evening on Aug. 29.

Whereas stocks tend to ebb and flow because of tangible financial metrics, such as their operating results and prevailing economic data, emotions and hype are known to move digital currencies. There’s little question that anticipation and hype have helped lift XRP to a more than seven-year high. The question is: Will the old Wall Street adage “buy the rumor, sell the news” put an end to this monstrous rally in the world’s No. 3 digital asset?

A person drawing an arrow to and circling the bottom of a steep decline in a crypto chart.

Image source: Getty Images.

XRP entered 2025 in an ideal situation

Whereas Murphy’s Law states that “anything that can go wrong, will go wrong,” XRP has had virtually everything go its way since early November 2024.

In November, Donald Trump won the presidency, which was viewed as a positive for most cryptocurrencies. Aside from Trump’s tinkering with the idea of a Bitcoin strategic reserve during his campaign, he was viewed as the friendliest presidential candidate to the crypto industry.

Since Trump’s inauguration, he’s signed the Genius Act into law, which established stablecoin backing and redemption standards, audit requirements, and federal oversight for the largest stablecoin issuers. While this doesn’t directly affect XRP, it paints a picture of an administration that’s willing to remove tight restrictions that had previously been placed on digital assets.

Another hyped event for XRP has been the expected approval of a spot XRP exchange-traded fund (ETF). A crypto spot ETF gives a buyer exposure to a specific digital asset without having to directly purchase it on a crypto exchange. In turn, buyers would pay a nominal fee (the net expense ratio) that covers the management and marketing costs for the fund.

When spot Bitcoin ETFs were first approved, massive cash inflows were observed for weeks. If spot XRP ETFs were to get the nod from the Securities and Exchange Commission (SEC) come October, a similar multiweek period of cash inflows would be expected.

However, the most-hyped event of all was the expected end to five years of litigation and appeals between the SEC and Ripple regarding whether or not Ripple sold XRP as an unregistered security. Ripple is the largest holder of XRP coins and is the company utilizing XRP as its intermediary payment token on RippleNet.

Last month, the SEC and Ripple agreed to drop their respective appeals. The news investors had waited years for had finally arrived — and so has the selling pressure on XRP.

XRP’s faults may be difficult to mask without a carrot at the end of the stick

Since the SEC sued Ripple in 2020, ending this litigation had been viewed as the carrot at the end of the stick that kept the hype train rolling. But with the appeal process over, sweeping XRP’s tangible faults under the rug could be tougher than ever before.

On paper, the lure of XRP is that it can assist with the rapid settlement of cross-border payments. The XRP Ledger is capable of validating and settling transactions in roughly three to five seconds, with payments costing just a fraction of a penny. This is considerably more palatable than the decades-long standard for cross-border payments. The Society for Worldwide Interbank Financial Telecommunication (SWIFT) can take days to settle international payments and is much costlier per transaction.

But there are some big-time caveats and catches to this seemingly slam-dunk thesis.

A businessperson removing a wooden piece from an unstable Jenga tower.

Image source: Getty Images.

For starters, banks aren’t required to use XRP as an intermediary on Ripple’s payment networks. If global financial institutions use Ripple’s payment network but not XRP, demand for XRP tokens will likely be insufficient to support its nearly 400% price appreciation over the trailing year.

The adoption rate for RippleNet isn’t all that impressive, either. Whereas more than 11,000 financial institutions are using SWIFT as their preferred cross-border payment solution, only an estimated 300 global financial institutions are relying on RippleNet in some capacity. While some investors might view this as a glass-half-full opportunity for RippleNet to gain share over time, it also speaks to the ironclad grip the SWIFT network has on international payments.

This is a good time to note that XRP lacks standalone value. Unlike Bitcoin, which can be used as a form of payment and is often viewed as an inflationary hedge amid a steadily increasing U.S. money supply, there is no standalone use case for XRP, save as an intermediary for some transactions on Ripple’s payment platform.

Lastly, XRP isn’t even guaranteed to be the preferred cross-border payment coin. Though there’s no denying it’s connections to larger financial institutions, Solana offers notably faster and inexpensive transaction settlement. In addition, peer-to-peer payment platform Stellar can settle payments just as quickly as XRP.

With XRP’s big event now firmly in the rearview mirror, profit-taking may be the new norm.

Source link

Why Circle Internet (CRCL) Stock Fell 28.1% Last Month

Circle’s stablecoin business is booming, but many investors ran for the exits in August anyway. Here’s what spooked them.

Shares of Circle Internet Group (CRCL -8.71%) took a 28.1% hit in August 2025, according to data from S&P Global Market Intelligence. The group behind the USDC (USDC -0.00%) stablecoin posted its first earnings report as a public company in the middle of the month, and it wasn’t strong enough to support Circle’s early price jump.

Circle’s earnings landed with a thud

From the initial public offering (IPO) on June 4 to the end of July, Circle’s stock had gained a hair-raising 492%. Investors were watching the first earnings report closely, looking for signs that Circle’s business could sustain a $42.0 billion market cap.

But that bullish outcome wasn’t in the cards. Sure, the results were impressive, given that Circle’s core business is based on an asset that will always be worth $1 per coin. Revenue rose 53% year over year to $658 million as the active circulation of USDC nearly doubled to $61.3 billion. But Circle still posted a net loss of $482 million in the second quarter, largely due to costs associated with the IPO. The price spike itself was the root cause of these charges, as the skyrocketing stock price changed the value of Circle’s convertible debt and stock-based compensation policies.

An investor rubs their frowning brow in front of several computer screens filled with market charts.

Image source: Getty Images.

The boring banking secret behind Circle’s exciting revenue

It may sound strange that Circle generated a $658 million revenue stream in the second quarter, even though the USDC stablecoin neither gained nor lost any value. But the company operates much like a classic bank — it earns interest on the dollar-based funds that provide direct backing for the stablecoin. These interest payments accounted for 96.4% of Circle’s total revenue in the second quarter.

As for the stock’s price drop, it should be noted that the slide started well before Circle’s earnings report. As of Sept. 2, Circle’s share price is down 54.4% from the absolute peak on June 23. The big surge followed by a steep price drop is pretty common for big-name IPOs, and Circle was one of the most anticipated market launches in recent memory.

Only CoreWeave (CRWV -9.41%) and Figma (FIG -6.70%) have seen splashier IPOs in 2025, and they have indeed followed similar charting patterns. Figma’s stock is down 46.2% from a soaring peak just after its IPO in July, while CoreWeave took a couple of months to build a 359% gain and then lose nearly half of it.

I rarely jump on IPO launches, because early investors tend to get burned rather quickly. Circle provided yet another example of a well-worn charting drama. And I’m not entirely convinced that Circle’s cool-off period has ended yet. You should probably avoid this red-hot financial technology stock until it stabilizes at a more plausible valuation.

Anders Bylund has no position in any of the stocks mentioned. The Motley Fool has no position in any of the stocks mentioned. The Motley Fool has a disclosure policy.

Source link

Gold Reserve Files Notice of Objection to Amber Energy Bid and Provides Update on Other Recent Filings in CITGO Sale Process

Article content

PEMBROKE, Bermuda — Gold Reserve Ltd. (TSX.V: GRZ) (BSX: GRZ.BH) (OTCQX: GDRZF) (“Gold Reserve” or the “Company”) provides an update on three recent filings in the CITGO Sale Process being run by the U.S. District Court for the District of Delaware (the “Court”):

Article content

1. On September 2, 2025, the Company filed a Notice of Competing Objection and Disclosure of Bid Materials in which it confirmed that it is a Competing Objector, and therefore that it will present its Improved Bid to the Court and request that it be approved instead of the $2 billion lower-priced Amber Energy bid. In conjunction therewith, the Company filed bid materials that had not already been filed on the public docket. A copy of the filing will be posted here.

Article content

Article content

Article content

2. On September 2, 2025, the Company filed a letter with the Court in which it joined the Venezuela Parties’ request that the Court direct the Special Master to serve fully unredacted versions of the transcripts of the Special Master’s August 11 and 13 ex parte conferences with the Court on parties that have signed a confidentiality agreement with the Special Master. A copy of the letter will be posted here.

Article content

Article content

3. On August 30, 2025, the Company filed a letter with the Court requesting, in connection with the Special Master’s Updated Final Recommendation, that the Court stay its decision on the Special Master’s request to terminate the Dalinar Energy bid until the Court rules on Gold Reserve’s pending Motion to Strike the Amber Energy bid or, in the alternative, that the Court set a briefing schedule for the Special Master’s request that tracks the existing schedule for objections to the Updated Final Recommendation. A copy of the filing will be posted here.

Article content

A complete description of the Delaware sale proceedings can be found on the Public Access to Court Electronic Records system in Crystallex International Corporation v. Bolivarian Republic of Venezuela, 1:17-mc-00151-LPS (D. Del.) and its related proceedings.

Article content

Cautionary Statement Regarding Forward-Looking statements

Article content

This release contains “forward-looking statements” within the meaning of applicable U.S. federal securities laws and “forward-looking information” within the meaning of applicable Canadian provincial and territorial securities laws and state Gold Reserve’s and its management’s intentions, hopes, beliefs, expectations or predictions for the future. Forward-looking statements are necessarily based upon a number of estimates and assumptions that, while considered reasonable by management at this time, are inherently subject to significant business, economic and competitive uncertainties and contingencies. They are frequently characterized by words such as “anticipates”, “plan”, “continue”, “expect”, “project”, “intend”, “believe”, “anticipate”, “estimate”, “may”, “will”, “potential”, “proposed”, “positioned” and other similar words, or statements that certain events or conditions “may” or “will” occur. Forward-looking statements contained in this press release include, but are not limited to, statements relating to any bid submitted by the Company for the purchase of the PDVH shares (the “Bid”).

Article content

Article content

We caution that such forward-looking statements involve known and unknown risks, uncertainties and other risks that may cause the actual events, outcomes or results of Gold Reserve to be materially different from our estimated outcomes, results, performance, or achievements expressed or implied by those forward-looking statements, including but not limited to: the discretion of the Special Master to consider the Bid, to enter into any discussions or negotiation with respect thereto; the Special Master may not recommend the Bid in the Final Recommendation; an objection to the Bid may be upheld by the Court; the Bid will not be approved by the Court as the “Final Recommend Bid” under the Bidding Procedures, and if approved by the Court may not close, including as a result of not obtaining necessary regulatory approvals, including but not limited to any necessary approvals from the U.S. Office of Foreign Asset Control (“OFAC”), the U.S. Committee on Foreign Investment in the United States, the U.S. Federal Trade Commission or the TSX Venture Exchange; failure of the Company or any other party to obtain sufficient equity and/or debt financing or any required shareholders approvals for, or satisfy other conditions to effect, any transaction resulting from the Bid; that the Company may forfeit any cash amount deposit made due to failing to complete the Bid or otherwise; that the making of the Bid or any transaction resulting therefrom may involve unexpected costs, liabilities or delays; that, prior to or as a result of the completion of any transaction contemplated by the Bid, the business of the Company may experience significant disruptions due to transaction related uncertainty, industry conditions, tariff wars or other factors; the ability to enforce the writ of attachment granted to the Company; the timing set for various reports and/or other matters with respect to the Sale Process may not be met; the ability of the Company to otherwise participate in the Sale Process (and related costs associated therewith

Article content

Article content

; the amount, if any, of proceeds associated with the Sale Process; the competing claims of other creditors of Venezuela, PDVSA and the Company, including any interest on such creditors’ judgements and any priority afforded thereto; uncertainties with respect to possible settlements between Venezuela and other creditors and the impact of any such settlements on the amount of funds that may be available under the Sale Process; and the proceeds from the Sale Process may not be sufficient to satisfy the amounts outstanding under the Company’s September 2014 arbitral award and/or corresponding November 15, 2015 U.S. judgement in full; and the ramifications of bankruptcy with respect to the Sale Process and/or the Company’s claims, including as a result of the priority of other claims. This list is not exhaustive of the factors that may affect any of the Company’s forward-looking statements. For a more detailed discussion of the risk factors affecting the Company’s business, see the Company’s Management’s Discussion & Analysis for the year ended December 31, 2024 and other reports that have been filed on SEDAR+ and are available under the Company’s profile at www.sedarplus.ca.

Source link

Can This Unstoppable Vanguard ETF Make You a Millionaire?

This fund could help you earn well over $1 million with next to no effort on your part.

Close to 40% of U.S. adults don’t believe they’ll ever be considered “wealthy” in their lifetime, according to a 2025 survey from Charles Schwab, and 27% don’t think they’ll be “financially comfortable” either.

While building wealth isn’t necessarily easy, investing in the stock market is one of the most effective ways to make a lot of money over time. Exchange-traded funds (ETFs) are a particularly good choice for those seeking a simpler way to generate wealth, as these investments require next to no effort on your part.

There are numerous ETFs to choose from, each with their unique advantages and disadvantages. However, there’s one Vanguard fund that can help you accumulate $1 million or more while also mitigating risk. Here’s how.

Person holding hundred dollar bills against a blue background.

Image source: Getty Images.

A growth ETF with a proven track record

An ETF is a collection of stocks grouped together into a single fund. Some ETFs track major market indexes, while others follow particular sectors of the market or even more niche sub-sectors.

If you’re looking for an investment that can potentially make you a millionaire while also helping to protect against risk, the Vanguard S&P 500 Growth ETF (VOOG -0.79%) could be a fantastic option. It follows the S&P 500 (^GSPC -0.69%), but instead of containing stocks from all 500 companies within the index, it only includes the 213 stocks with the most potential for growth.

One of the primary advantages of this fund is its balance of risk and reward. The companies within the S&P 500 are among the largest and strongest in the U.S., and many are industry leaders with decades of experience navigating economic uncertainty. While there are no guarantees when investing, juggernaut businesses like those in the S&P 500 are more likely to survive periods of market turbulence.

At the same time, though, because this ETF only includes the stocks with potential for faster-than-average growth, you’re more likely to earn higher returns than you would with a standard S&P 500 ETF.

A downside to consider, however, is that with less diversification, this fund does carry more risk than a standard S&P 500 ETF. Growth stocks can often be more volatile than those from more established industries, and because this fund only contains stocks poised for significant growth, it could face more severe ups and downs than the S&P 500.

Accumulating $1 million or more

Nobody knows where the market will be in a few months or a year, so before you buy, be sure you’re willing to stay invested for at least five to 10 years — or, ideally, a couple of decades. The longer your timeline, the less you’ll need to worry about short-term volatility.

There are also no guarantees that any investment will continue to earn returns similar to what it has in the past, but historical returns can be a good starting point to see roughly how much you could potentially earn.

Over the last 10 years, the Vanguard S&P 500 Growth ETF has earned an average rate of return of 15.79% per year. For comparison, the Vanguard S&P 500 ETF has earned an average return of just 13.62% per year in that time.

Let’s say you were to invest $200 per month. Here’s approximately how much you could accumulate over time, depending on whether you’re earning a 15.79% or 13.62% average annual return:

Number of Years Total Portfolio Value: 15.79% Avg. Annual Return Total Portfolio Value: 13.62% Avg. Annual Return
15 $122,000 $102,000
20 $270,000 $209,000
25 $579,000 $411,000
30 $1,221,000 $795,000

Data source: author’s calculations via investor.gov.

The difference between 13% and 15% average annual returns may not seem like much, but it can add up to nearly half a million dollars over three decades. If you have even a few extra years to invest, you could earn exponentially more.

Investing in ETFs is a lower-effort way to generate wealth, as you never need to choose individual stocks or decide when to buy or sell. The Vanguard S&P 500 Growth ETF is a powerhouse fund that can help balance risk and reward, and with enough time, you could build a million-dollar portfolio while barely lifting a finger.

Katie Brockman has positions in Vanguard Admiral Funds-Vanguard S&P 500 Growth ETF and Vanguard S&P 500 ETF. The Motley Fool has positions in and recommends Vanguard S&P 500 ETF. The Motley Fool has a disclosure policy.

Source link

Stock Market Today: Nvidia Extends Slide as AI Momentum Stalls

NVIDIA Corp (NASDAQ: NVDA) dropped 1.91% on Tuesday to $170.78, its fourth consecutive decline. The stock traded 229.04 million shares, well above its 3‑month average, suggesting strong investor activity amid mounting unease.

Wider markets mirrored the weakness, with the S&P 500 (SNPINDEX: ^GSPC) falling 0.69% and the Nasdaq Composite (NASDAQINDEX: ^IXIC) down 0.82%, driven by concerns over valuation and AI-linked demand slowing.

NVIDIA’s sector peers also declined. Advanced Micro Devices Inc (NASDAQ: AMD) edged down 0.19% to $162.32, while Intel Corp (NASDAQ: INTC) slipped 0.57% to $24.21.

The continued pressure follows NVIDIA’s cautious revenue forecast last week, which has raised fresh doubts about the near-term pace of AI infrastructure investment. Despite strong long-term demand signals, many investors appear to be recalibrating expectations in the face of mounting macro headwinds.

Market data sourced from Google Finance and Yahoo! Finance on Tuesday, Sept. 2, 2025.

Should you invest $1,000 in Nvidia right now?

Before you buy stock in Nvidia, consider this:

The Motley Fool Stock Advisor analyst team just identified what they believe are the 10 best stocks for investors to buy now… and Nvidia wasn’t one of them. The 10 stocks that made the cut could produce monster returns in the coming years.

Consider when Netflix made this list on December 17, 2004… if you invested $1,000 at the time of our recommendation, you’d have $651,599!* Or when Nvidia made this list on April 15, 2005… if you invested $1,000 at the time of our recommendation, you’d have $1,067,639!*

Now, it’s worth noting Stock Advisor’s total average return is 1,049% — a market-crushing outperformance compared to 185% for the S&P 500. Don’t miss out on the latest top 10 list, available when you join Stock Advisor.

See the 10 stocks »

*Stock Advisor returns as of August 25, 2025

Daily Stock News has no position in any of the stocks mentioned. This article was generated with GPT-4o, OpenAI’s large-scale language generation model and has been reviewed by The Motley Fool’s AI quality control systems. The Motley Fool has positions in and recommends Advanced Micro Devices, Intel, and Nvidia. The Motley Fool recommends the following options: short August 2025 $24 calls on Intel and short November 2025 $21 puts on Intel. The Motley Fool has a disclosure policy.

Source link

Stock Market Today: NIO Jumps as Glimmers of Profitability Emerge


Nio
(NYSE: NIO) climbed 3.1% on Tuesday to close at $6.58, rallying on the back of second-quarter earnings that demonstrated its strongest showing since Q4 2023. The EV maker posted a smaller-than-expected $567 million loss and improved its margin to 10%, suggesting a potential turnaround. Heavy trading volume of 119.6 million shares (nearly double its average) underscored heightened investor interest.

The broader markets dipped, with the S&P 500 (SNPINDEX: ^GSPC) sliding 0.7% and the Nasdaq Composite (NASDAQINDEX: ^IXIC) falling 0.8%.

NIO peers, Li Auto (NASDAQ: LI) and BYD Company (OTC: BYDDY), also advanced on Tuesday. Li Auto rose 4.5% to $24.40, while BYD climbed 2.9% to $14.04, as both stocks benefited from continued excitement around Chinese EV demand.

The optimism stems from NIO’s substantial 26% year-over-year jump in Q2 deliveries and a 55% rise in August units. Coupled with margin improvement and tighter cost controls, these gains suggest the company may reach profitability as early as Q4, positioning it as a standout in an otherwise challenging EV landscape.

Market data sourced from Google Finance and Yahoo! Finance on Tuesday, Sept. 2, 2025.

Should you invest $1,000 in Nio right now?

Before you buy stock in Nio, consider this:

The Motley Fool Stock Advisor analyst team just identified what they believe are the 10 best stocks for investors to buy now… and Nio wasn’t one of them. The 10 stocks that made the cut could produce monster returns in the coming years.

Consider when Netflix made this list on December 17, 2004… if you invested $1,000 at the time of our recommendation, you’d have $651,599!* Or when Nvidia made this list on April 15, 2005… if you invested $1,000 at the time of our recommendation, you’d have $1,067,639!*

Now, it’s worth noting Stock Advisor’s total average return is 1,049% — a market-crushing outperformance compared to 185% for the S&P 500. Don’t miss out on the latest top 10 list, available when you join Stock Advisor.

See the 10 stocks »

*Stock Advisor returns as of August 25, 2025

Daily Stock News has no position in any of the stocks mentioned. This article was generated with GPT-4o, OpenAI’s large-scale language generation model and has been reviewed by The Motley Fool’s AI quality control systems.The Motley Fool recommends BYD Company. The Motley Fool has a disclosure policy.

Source link

Why Is Snap Stock Falling, and Is It a Buying Opportunity?

Snap (NYSE: SNAP) is losing social media accounts from the most lucrative part of the world.

Where to invest $1,000 right now? Our analyst team just revealed what they believe are the 10 best stocks to buy right now. Continue »

*Stock prices used were the afternoon prices of Aug. 29, 2025. The video was published on Aug. 31, 2025.

Should you invest $1,000 in Snap right now?

Before you buy stock in Snap, consider this:

The Motley Fool Stock Advisor analyst team just identified what they believe are the 10 best stocks for investors to buy now… and Snap wasn’t one of them. The 10 stocks that made the cut could produce monster returns in the coming years.

Consider when Netflix made this list on December 17, 2004… if you invested $1,000 at the time of our recommendation, you’d have $651,599!* Or when Nvidia made this list on April 15, 2005… if you invested $1,000 at the time of our recommendation, you’d have $1,067,639!*

Now, it’s worth noting Stock Advisor’s total average return is 1,049% — a market-crushing outperformance compared to 185% for the S&P 500. Don’t miss out on the latest top 10 list, available when you join Stock Advisor.

See the 10 stocks »

*Stock Advisor returns as of August 25, 2025

Parkev Tatevosian, CFA has no position in any of the stocks mentioned. The Motley Fool has no position in any of the stocks mentioned. The Motley Fool has a disclosure policy. Parkev Tatevosian is an affiliate of The Motley Fool and may be compensated for promoting its services. If you choose to subscribe through his link, he will earn some extra money that supports his channel. His opinions remain his own and are unaffected by The Motley Fool.

Source link

Why Constellation Brands Stock Pulled Back Today

A guidance cut sank the shares.

Shares of Constellation Brands (STZ -7.17%), the diversified alcohol company best known for selling Corona and Modelo beer in the U.S., were moving lower today after management slashed its full-year guidance in an early update.

As a result, the stock was down 6.7% as of 1:28 p.m. ET on Tuesday.

Beer being bottled in a factory.

Image source: Getty Images.

Constellation feels the immigration crackdown

In a press release this morning, the company slashed its adjusted earnings-per-share (EPS) forecast for the year from a range of $12.60 to $12.90, to a range of $11.30 to $11.60. It now sees organic net sales down anywhere from 4% to 6%, compared to a forecast of a 2% decline to a 1% gain, due to weakness in the beer category, which makes up the bulk of the business. The company’s fiscal year ends on Feb. 28, 2026.

CEO Bill Newlands said, “We continue to navigate a challenging macroeconomic environment that has dampened consumer demand and led to more volatile consumer purchasing behavior since our first quarter of fiscal 2026.”

He also noted that “high-end beer buy rates decelerated sequentially,” especially for Hispanic consumers, which seemed to be a consequence of the immigration crackdown.

Nonetheless, the company said it continued to gain market share, showing it’s outperforming its peers.

What’s next for Constellation Brands

Constellation and its peers are already struggling with a number of headwinds in the alcohol sector as young people are drinking less, tariffs are weighing on global sales, and craft brewers continue to challenge the major brewers.

The stock surged over a multiyear period a decade ago after it secured the rights to sell the Mexican brands Corona and Modelo (the latter being the top-selling beer in the U.S.) from what was then Anheuser-Busch, but it’s struggled since then. The guidance cut and challenges in the beer industry show investors shouldn’t expect a quick turnaround, even if the stock has attracted backing from Warren Buffett’s Berkshire Hathaway, possibly a sign Buffett believes it offers good value.

Jeremy Bowman has no position in any of the stocks mentioned. The Motley Fool has positions in and recommends Berkshire Hathaway. The Motley Fool recommends Constellation Brands. The Motley Fool has a disclosure policy.

Source link

NIO (NIO) Q2 2025 Earnings Call Transcript

Image source: The Motley Fool.

Date

Tuesday, Sept. 2, 2025, at 8 a.m. ET

Call participants

  • Chief Executive Officer — William Li
  • Chief Financial Officer — Stanley Qu
  • Investor Relations — Rui Chen

Need a quote from a Motley Fool analyst? Email [email protected]

Takeaways

  • Vehicle deliveries— 72,056 smart EVs delivered in Q2 2025, representing 25.6% year-over-year growth.
  • Revenue— Total revenue of RMB19 billion for Q2 2025, up 57.9% quarter over quarter.
  • Vehicle sales— RMB16.1 billion in vehicle sales for Q2 2025, reflecting 2.9% year-over-year growth and a 62.3% quarter-over-quarter increase in vehicle sales revenue.
  • Other sales— RMB2.9 billion for Q2 2025, a year-over-year growth of 62.6% and a 37.1% increase quarter over quarter.
  • Vehicle gross margin— 10.3% vehicle margin.
  • Overall gross margin— 10% overall gross margin.
  • Non-GAAP operating loss— Adjusted loss from operations was RMB4 billion (non-GAAP), down 14% year over year and 32.1% quarter over quarter (adjusted, non-GAAP).
  • Non-GAAP net loss— Adjusted net loss was RMB4.1 billion (non-GAAP), decreasing 9% year over year and 34.3% quarter over quarter (adjusted net loss, non-GAAP).
  • Q3 delivery guidance— Management expects 87,000 to 91,000 deliveries, representing 40.7%-47.1% year-over-year growth.
  • Q4 delivery target— The company targets average monthly deliveries of 50,000 units, for a quarterly target of 150,000 units across three brands.
  • Q4 group vehicle gross margin target— Management expects 16%-17% group vehicle margin, with L90 and ES8 targeted at 20% each.
  • R&D expenses— Non-GAAP R&D expense guided at RMB2 billion per quarter for Q3 and Q4.
  • SG&A expenses— Non-GAAP SG&A guided to be within 10% of sales revenue in Q4.
  • Non-GAAP breakeven guidance— The company expects group non-GAAP operating breakeven in Q4.
  • Third-generation platform highlights— CEO Li cited high-voltage architecture, lightweight battery packs, and in-house smart driving chip as major contributors to cost and product efficiency.
  • Production ramp— L90 supply chain capacity targeted at 15,000 units per month in October.
  • No new model launches for remainder of 2025— Management said no additional model launches or deliveries are planned for the rest of the year, citing full production allocation to existing models.
  • Firefly brand— Over 10,000 Firefly deliveries within three months, now the top-selling model in the high-end small bath market.
  • Charging & swap network— 3,542 power swap stations and over 27,000 charging points deployed worldwide as of July 2025.

Summary

NIO(NIO 0.70%) reported a 57.9% sequential increase in total revenue, driven primarily by expanding vehicle deliveries and substantial contributions from other sales, including used vehicles, R&D services, and after-sales support. Management reaffirmed momentum with a delivery outlook of up to 91,000 units for Q3 and set aggressive Q4 production targets for the L90 and ES8 models. Cost optimization is being achieved through a revamped organizational structure and deployment of self-developed technology platforms, which underpin sequential improvement in operating and net losses on a non-GAAP basis. The company highlighted non-GAAP targets for Q4 vehicle margin (16%-17%) and brand-level margins (20% for key new models), together with breakeven guidance on a non-GAAP basis, supported by disciplined R&D and SG&A spending. Management outlined no further model launches in 2025, reallocating resources to maximize production output and market responsiveness.

  • CEO Li emphasized, “Vehicle gross margin in Q4 is expected to be around 16% to 17% for the entire group to achieve breakeven,” confirming the margin focus embedded in model launches and supply chain management.
  • CEO Li stated there is “no major impact” on margins due to exchange of prior offers for upgraded battery standardization.
  • Management attributed margin and cost improvements to technology, including proprietary smart driving chips and a 900-volt architecture, that reduce BOM cost and enable aggressive pricing without eroding profitability.
  • The self-developed chip NX9031 is positioned to offer chip performance “on par with four flagship chips in the industry,” according to CEO Li, yielding cost savings without disclosing per-unit figures.
  • Supply and production capacity were cited as current constraints on further launches, with combined production capacity of all three brands in Q4 expected to be as high as 56,000 units a month to support demand.

Industry glossary

  • BOM (Bill of Materials) cost: Total spend on raw materials and components directly attributable to manufacturing a finished product.
  • Power swap: NIO’s proprietary technology/platform that enables drivers to exchange depleted EV batteries for fully charged ones at dedicated stations.
  • High-voltage (900V) architecture: Vehicle electrical infrastructure designed to improve charging speed, energy efficiency, and support advanced vehicle functionality.
  • NX9031: In-house smart driving chip developed and deployed by NIO for advanced autonomous and smart vehicle features.

Full Conference Call Transcript

William Li: Hello, everyone. Thank you for joining NIO’s 2025 Q2 earnings call. In Q2, the company delivered 72,056 smart EVs, up 25.6% year over year. The new brand refreshed four products to model year 2025, further enhancing its product competitiveness. With improved organizational efficiency and growing brand awareness, the Envoy brand is gaining momentum in the mainstream family market. And thanks to the clear product positioning and deep market insight into the high-end small car market, the Firefly has been well received by the target audience. The company delivered 21,017 vehicles in July and 31,305 in August.

The launch of the Envoy L90 in late July and the pre-launch of the new all-new ES8 in late August dropped strong market demand, boosted user confidence, and lifted overall sales. We expect total deliveries in Q3 to range from 87,000 to 91,000, representing a new high of 40.7% to 47.1% growth year over year. On the financial side, vehicle gross margin remained stable while other sales saw significant margin improvements. Moreover, the implementation of the cell business unit mechanism has begun to yield tangible cost reductions and efficiency gains. In Q2, the non-GAAP operating loss narrowed more than 30% quarter over quarter.

Since the start of deliveries in Q2, NIO ET9 has performed strongly in the executive flagship sedan market. Building on continuous R&D investments, NIO was the first to bring the in-house developed smart driving chip and full domain vehicle operating system on production models such as ET9 as well as the 2025 ET5, ET5T, ES6, and EC6. In late June, we rolled out the new world model across all new vehicles equipped with our proprietary smart driving chip.

Within just five months, this in-house developed chip enabled the mass release of functions and the seamless migration of core models and applications across five vehicle models, representing China’s and also the industry’s first full function delivery on a self-developed flagship smart driving chip. On August 21, NIO hosted the product and the technology launch of its core strategic model, the all-new ES8. As an all-around tech flagship SUV designed for the success of business, family, and individuals, the third-generation ES8 is an epitome of NIO’s tech innovation.

The all-new ES8 features original and distinctive design language, class-leading capping and storage space, premium features and comfort experience, flagship safety as well as smart driving and cabin experience ahead of its time. It is the most competitive model in the premium large zero SUV segment, receiving significant attention and recognition from both media and users. Pre-orders have started with test drives starting in mid-September followed by the official launch at NIO Day in late September and deliveries afterward.

On July 31, the Ambo L90, a game-changing product among large three-row family SUVs, was launched with ingenious space and comfort design, all-around smart safety, competitive pricing, and comprehensive charging and swapping services, the Almighty redefines the large zero SUV experience, making it a good fit for large families. The Envoy L90’s sales performance exceeds our expectations. In its first full delivery month, its deliveries reached a history high of 10,575. We are working closely with our supply chain partners for the ramp-up production capacity and keep pace with the strong market demand. L90’s strong market performance has also boosted Ango’s brand awareness and the demand for the L60.

In August, the L60’s order intake also hit a new high this year. As for Firefly, since deliveries begun over 10,000 Firefly has been delivered within just three months. It’s already the best-selling model in the high-end small bath market. Its novel design, flagship-level safety, and agile driving dynamics have been well received. Notably, in recent CIA SI test Firefly together with the ARMOR L60 achieved the highest safety rating ever. We are pleased to see the growing brand awareness is driving growing demand for Firefly.

In terms of product quality in June, MiO ET5 and ET5T ranked segment first in JD Power’s NEV IQF study, while the EC6 and ES6 ranked top two in the premium fab segment in J.D. Power’s NEV appeal study. With outstanding product quality, NIO has been the segment leader in J.D. Power’s quality study for seven consecutive years in 2019. As of now, the company operates 176 NIO Houses and four sixteen NIO Spaces as well as four fourteen Amo stores. On the service side, the company has three eighty-eight service centers and 68 delivery centers. Our sales and service network now operates efficiently and cohesively across all three brands earning recognition from our users.

Regarding charging and swapping, the company has 3,542 power swap stations worldwide, including over 1,000 stations on highways in China and has provided over 84,000,000 swaps to users. By July, the battery swap network had thoroughly covered the highways between major cities in China, connecting five fifty cities with three-minute swaps and eliminating users’ fringe anxieties on long trips. In August, we completed the power swap route along China’s iconic G318 Sichuan Hizhang Highway. NIO and Amo users now can drive their cars and swap all the way to the base camp of Mount Kumolama. Besides, the company has built over 27,000 superchargers and destination chargers. So far, NIO is the car company with the most chargers in China.

In Q2, NIO has entered a new cycle where its continuous investment in technology innovation, infrastructure, and the multi-brand strategy in the past decade begun to translate into market competitiveness. The strong sales momentum of the new All New ES8 and ARMOR L90 proves that our decade-long commitment to the fab roadmap with chargeable, swappable, and upgradable technologies can create user value beyond expectations, increasingly recognized and embraced by a growing base of users. We believe the all-new ES8 and L90 will drive the transition of the large rear wheel SUV market towards full electrification and boost the sales growth across other models.

At the same time with NIO’s continued efforts in the charging and swapping infrastructure, its power swap network now covers major highways and expands into more counties in China. As the network effect of power swap is becoming more evident, over time more users will experience and understand the unique benefits of the NIO Power Swap. Built on the company’s 12 full stack technological capabilities and the nationwide charging and swapping network, the three brands are reaching a broader user base. Starting in Q3, the multi-brand strategy will drive our sales growth and capture greater market shares across the various segments, helping to advance our mission of shaping a sustainable and brighter future.

Since the beginning of this year, the company has focused on systematically enhancing operational efficiency and execution, leading to significant improvement in both R and D as well as sales and service. With rising sales, improving gross margin and the more efficient cost of control, we expect to see a substantial improvement in the company’s financial performance paving the way for the next phase of rapid growth. Thank you for your support. With that, I will now turn the call over to Stanley for Q2’s financial details. Over to you Stanley.

Stanley Qu: Thank you, William. Let’s now review our key financial results for the 2025. Our total revenues reached RMB19 billion, increased 9% year over year and 57.9% quarter over quarter. Vehicle sales were RMB16.1 billion, up 2.9% year over year and 62.3% quarter over quarter. The year-over-year growth was mainly due to higher deliveries, partially offset by a lower average selling price from product mix changes. The quarter-over-quarter increase was mainly from higher deliveries. Other sales were RMB2.9 billion, grew by 62.6% year over year and 37.1% quarter over quarter.

The annual growth was driven by increased sales of used cars, technical R and D services, sales of parts and after-sales of vehicle services at Power Solutions, while the quarter-over-quarter increase was mainly due to the increase in revenues from used cars, technical R and D services, parts accessories and after sales vehicle services. Looking at margins, vehicle margin was 10.3% compared with 12.2% in Q2 last year and 10.2% last quarter. The year-over-year decline was mainly due to changes in product mix, partially offset by lower material cost per unit, while quarter-over-quarter vehicle margin remained stable. Overall gross margin was 10% versus 9.7% in Q2 last year and 7.6% last quarter.

The year-over-year gross margin stayed stable and the quarter-over-quarter increase was mainly attributable to positive mix effect driven by the increase in revenue from used cars and technical R and D services. Turning to OpEx. R and D expenses were RMB3 billion, decreased 6.6% year over year and 5.5% quarter over quarter. The decreases year over year and quarter over quarter was mainly driven by lower design and development costs from different development stages, with the year-over-year also reflecting reduced depreciation and amortization expenses. SG and A expenses were RMB4 billion, up 5.5% year over year and down 9.9% quarter over quarter.

The year-over-year increase was mainly driven by higher personnel costs, rental and related expenses associated with the expansion of sales and service network, partially offset by decreased sales and marketing activities. The quarter over quarter decrease was mainly due to the decrease in personnel costs and marketing and promotional expenses, primarily driven by the company’s comprehensive organizational optimization efforts in marketing and other supporting functions. Loss from operations was RMB4.9 billion, down 5.8% year over year and 23.5% quarter over quarter. Excluding share based compensation expenses and organizational optimization charges, adjusted loss from operation was RMB4 billion, representing a decrease of 14% year over year and 32.1% quarter over quarter.

Net loss was RMB5 billion, showing a decrease of 1% year over year and a decrease of 22% quarter over quarter. Excluding share based compensation expenses and organizational optimization charges, adjusted net loss was RMB4.1 billion, representing a decrease of 9% year over year and 34.3% quarter over quarter. That wraps up our prepared remarks. For more information and the details of our unaudited second quarter 2025 financial results, please refer to our earnings press release. Now I will turn the call over to the operator to start our Q and A session.

Operator: Your first question comes from Geoff Chung from Citi. Please go ahead.

Geoff Chung: Hi, this is Geoff from Citi. Thank you, Li Bin Zhong and Stanley Zhong and congratulate with the good result. My first question is about ES8 and L90’s capacity ramp up pace and the delivery target for the rest of the year. And due to the strong order backlog, can we expect December single month run rate for the group to hit 55,000 unit or above? This is my first question.

William Li: Thank you for the question. It’s true that with the launch of the Envoy L90 and also the new Audio ES8, we actually see a stronger market demand higher than what we’ve expected before the launch. In that case, we’ve been working closely with our supply chain partners to improve and enhance the production capacity throughout the value chain and also the supply chain. Our target is that in October the full supply chain capacity for the Envoy L90 can achieve and reach 15,000 units a month. And for the ES8 as the ramp up of production takes slightly longer, we hope that the full supply chain capacity can achieve 150,000 units in December.

With that by looking at both the demand and the supply availabilities and capacity, our Q4 target is to achieve an average of 50,000 units deliveries per month for all three brands, which means that in Q4 our quarterly delivery target combining all three brands is 150,000 units.

Geoff Chung: Thank you, Li Bin Zhong. So my second question is about the gross profit margin and whether fourth quarter can breakeven at the bottom line level. So if we look at the second quarter, our revenue up 58%, but our gross profit up more than 100% Q on Q. So could you give us more color on the second half vehicle GP margin trend and the non vehicle GP margin trend? And also to be specific, how do you see the L90 and the ES8 GP margin independently? Thank you very much.

William Li: Thank you for the question. I would like to walk you through our Q2 product margin. In terms of the vehicle margin in the second quarter of this year, it was 10.3%. As in the second quarter, we have conducted the model year upgrades on the ET5, ET5T, EC6 and ES6 as the product upgrades happened in the mid and late May. In that case among the 72,000 units we’ve delivered in Q2 only around 20% was contributed by the model year ’25 products. In that case the actual margin improvement contributed by this four models is not that significant in comparison to Q1.

And then in the third quarter as we have the full quarter deliveries for the model year 2025 products as well as the start of deliveries of the L90, which will further help improve the vehicle gross margin. And then in Q4 as William mentioned starting late September, we are going to start the deliveries of the ES8. We expect the vehicle margin to further grow. So Q4 also represents the first full quarter for the deliveries of both L90 and ES8. With that, we expect the Q4 vehicle gross margin to be around 16% to 17% for the entire group to be able to achieve breakeven.

As based on the decade long battery bus tech innovation, the in house developed of core parts and components as well as the continuous efforts in the cost of control and the savings on the supply side as well as the product cost structure, We achieved not only competitive product performance for the L90 and beyond ES8, but also a very competitive cost structure and the pricing point. With that in Q4 our gross margin target for the L90 and ES8 is 20%. In terms of the gross margin of other sales, it’s 8.2 in Q2 and it’s mainly contributed by two factors.

The first is regarding the revenues contributed by our existing users, including via our aftermarket services, our auto financing business as well as the narrowed loss on the power services. And the second factor is regarding the margin contributed by our technological service provided to our partners. With this two combined, we’ve achieved a good and positive gross margin on other sales in Q2. And in terms of the revenues or margin contributed by the technological services we provide to the partners as it is highly dependent on the product and the project stage, the actual revenues contributed may not be consistent from quarter to quarter.

In that case excluding that part, our expectation for the gross margin on other sales is to be breakeven or slightly with a slight loss quarter over quarter.

Geoff Chung: Thank you for the new guidance. Looking forward to the fourth quarter. Thank you.

Operator: Thank you. Your next question comes from Bin Wang from Deutsche Bank. Please go ahead.

Bin Wang: Thank you. I just want to ask for more detail about number four quarter breakeven. Number one is that what’s your R and D expense for number three and number four quarter? I think you actually guide close to billion in the number four quarter. Do you still maintain the same guidance for the number four quarter? And secondly, it’s the same for SG and A. Lastly, what’s the breakeven means? Do you breakeven in the OP level or net profit level? Is GAAP or non GAAP? Thank you very much for my question.

William Li: Thank you for the question. Regarding the breakeven target, our quarterly breakeven target is based on the non GAAP basis. And regarding the R and D and SG and A guidance, starting Q2 this year, we have conducted a series of measures combining our CPU mechanism to control our R and D expenses. Our principle is that without compromising on the major and the core R and D activities and also product planning, we will keep improving the R and D efficiency, which means that without compromising or affecting our major product planning and R and D, we will push for higher efficiencies in the R and D activities.

With that our target for the Q3 and the Q4 R and D expenses on the non-GAAP basis will be RMB2 billion per quarter. And in terms of the SG and A expenses also based on our CPU mechanism we’ve conducted measures to improve the overall SG and A efficiency. In the second quarter, our sales volume is at the magnitude of around 70,000 units. So the SG and A ratio to the sales revenue still accounts for a relatively high percentage. But as in Q3 and Q4, we grow our sales volume and also sales revenue, we expect the percentage of SG and A in the sales revenues to actually coming down to a more reasonable range.

But as in Q3, we’re planning several new product launches, there will also be corresponding marketing and go to market expenses. In that case, in Q3, we are still not able to achieve a breakeven on the SG and A expenses. But in Q4 the non GAAP target for the SG and A expenses will be within 10% of the sales revenue.

Bin Wang: Thank you, Womin.

Operator: Thank you. Your next question comes from Tim Hsiao from Morgan Stanley. Please go ahead.

Tim Hsiao: Hi. This is Tim from Morgan Stanley. Thanks for taking my question. So I have two questions. The first one is about the new model pipeline. Given the robust demand of L90 and ESD that occupied our capacity, well, the company adjust the launch schedule for the upcoming models. And we noticed that the NIO days, has notably moved forward to late September. Can management also share more insight into the updated model pipeline in the following quarters? That’s my first question. Thank you.

William Li: Thank you for the question. It’s true that at the moment we actually prioritize the production of the L90 and also the All new ES8 from the production capacity perspective. For the ARMOR brand, we even have to really give way to the L90 productions and compromising on the production of L60. So that it will find that our L60 users are also waiting up to pick up their cars. So right now we actually have four models with backlog order backlogs accumulated and the users will need to wait for the new car pickup including L90, Onu ES8, L60 and also Firefly.

And regarding the production capacity for the ARMOR product starting October, we expect the capacity to come back to a normal range, mainly supported and fueled by the production capacity of the battery. As in the past several months, we’ve been working closely with our battery partners to ramp up the production capacity. With that in Q4 for the ARMOR brand, we expect the full supply chain production capacity to be around 25,000 units a month. And regarding the new brand for the launch of all new ES8, we also have challenges regarding the supply of the brand new 102 kilowatt hour battery.

As the demand of the ES8 is actually stronger than we expected, then we at the beginning we underestimated the demand for the ES8 and also the volume assumption for the battery packs. We’ve been working closely also with the battery suppliers and partners to secure the supply of this new battery pack. With that in Q4, we expect the full supply chain capacity for the new brand can also achieve a 25,000 units monthly capacity. And regarding FarFly, we are also steadily increased its production and supply capacity. And in Q4, we expect the production capacity to ramp up to up to 6,000 units a month at its peak.

So it means that in Q4, the combined production capacity of all three brands will be as high as 56,000 units a month to be able to support our demand. As we have already dedicated our full capacity to the production of the existing models in the market, So for this year, we will not have any new models launched or delivered to the market. Previously, we’ve mentioned that we plan to also launch the L80 of the Ambu brand. But as now we have run out of all the capacities available, we actually have to decide to delay the deliveries of this new model.

But in terms of the launch or the go to market cadence for the L80, that’s to be decided. In addition to the onboard L80, next year in the coming quarters, we also have another two new models coming under the new brand to also two large SUVs. One is the ES9 as many of the users and the public already know about it and also ES7, a large five seater SUV model. As for the New Day this year, as it is happening in September, the protagonist of this event will be definitely the all new ES8.

Tim Hsiao: Thank you, Lian. My second question is about the pricing strategy and also just a quick follow-up on the margin side. Because we noticed that both the L90 and the new ES8 have launched with aggressive pricing strategies. So I just want to know that will this pricing strategy be extended to all the upcoming models under both brands? And if that’s the case, how should we think about NIO’s gross profit margin trajectory into next year? What would be a more sustainable and ideal equal margin level once all the new models are upgraded next year? That’s my second question. Thank you.

William Li: Thank you for the question. For the entire company as we’ve also previously mentioned for the long term our group level product margin is actually 20%. That’s our target. More specifically on the gross margin by brand for the new brand our target is to achieve 20% vehicle gross margin and even target a higher margin of 25%. And for Anvil, no lower than 15% for the long term and for Firefly around 10%.

For the ES8 and the L90 newly launched this year as well as the new models coming up next year, we also have this we’ll also contribute to this target as at the product definition and design stage we have already prepared for an aggressive pricing strategy and our cost structure can also support such strategy to be able to achieve more competitive pricing of our products without compromising on the product competitiveness itself. This is actually driven and enabled by our decade-long tech innovation, technology accumulation, in house developed parts and systems and also stringent cost control.

Operator: Your question comes from Jing Cheng from CICC. Please go ahead.

Jing Cheng: Thank you for taking my questions. My first question is still about our L90 and also ES8. So we have already seen that these two new models have already demonstrated our enhanced product capability and also very competitive pricing still with a very solid gross profit margin. So besides previously Stanley has already told us of the technology and also the platform upgrades. Could you share more about the underlying successful experience about these two new models such as our changes on maybe supply chain, maybe the dealers networks? This is my first question.

William Li: Regarding the overall product competitiveness on the third generation, it is actually getting stronger and better. And this also allows for more competitive product competitiveness as well as the cost structure. And as we’ve mentioned, this is enabled by our continuous tech innovation. Let’s say the 900 volt high voltage architecture, this platform actually allows for more integrated and a lightweight design that’s not only in the powertrain system as well as the high voltage architecture throughout the vehicle to be able to achieve high performance and the lightweight design. Such lightweight design also allows for improved cost structure and also experience competitiveness.

For example, on the ES8 and also L90 we’ve achieved a huge frunk and also trunk space, such huge storage space is also enabled by the high integration level of our architecture and systems. And another example is regarding the smart technologies, the digital architecture. On the third generation, we adopted the innovative digital architecture with the central computing cluster plus the zonal controllers. This can help achieve a better cost as well as the mass performance and the management. Let me take e fuels as an example. Previously on other older models, there are physical fuse box, which is as heavy as 10 kilos per car and it can take up eight liters of space.

But with eFuse, we are able to integrate them into the master board that can actually manage the power supplies throughout the vehicle at a very detailed and precise level, but still contributing to the mass reduction and cost improvement. So this improvement in both cost structure as well as user experiences are enabled by the tech innovation. Another example is regarding our proprietary smart driving chip. Of course, we’ve made the major upfront investment in the chip development, but the performance of our in house developed smart driving chip NX9031 can achieve the performance that is on par with four flagship chips in the industry.

So R&D-wise, we made investment upfront yet BOM cost wise this smart driving chip can also achieve savings. And another thing is regarding the technology roadmap, mainly the chargeable, swappable and upgradeable technologies for our products. With this, we are able to select the most suitable and optimal battery packs, including its capacity and the size for our users. For example, for some of our peers and competitors, they actually needed to strike a balance between the battery cost and also the battery range. Then they choose the LFP as the chemical system and they make a battery pack of around 90 or 100 kilowatt-hour capacity.

But with that the battery pack is actually very big and heavy. If you look at our battery packs for the Envoy L90, put a 85 kilowatt hour battery inside and for the ES8, a 102-kilowatt-hour battery inside. They can achieve the driving range and performance on par with those peers. But in terms of the mass, the 80 fiveone is only around 400 kilos and the 102 kilowatt hour battery pack is only around 500 kilos. So it is actually around 200 kilos lighter than many of our peers’ solutions. This is also another mass and cost optimizations enabled by our chargeable swappable and upgradable tech solutions.

And in terms of a competitive product in both cost as well as the user experience, I think three things will define the competitiveness of a product. The first is regarding the technology roadmap, the second is regarding the product planning and the third is regarding the product definition itself. And our past practice and experiences prove that our technology roadmap, including our multi-brand strategy, our chargeable, swappable, upgradable solutions, our full stack tech capabilities develop in house as well as our product planning are in general in the right direction. Yet when it comes to the product definition, we did have some lessons learned from the previous generations and platforms.

With that on the third generation with our all new ES8 and L90, we not only draw the best practices from the industry and peers, but also make corrections from within to be able to achieve a better product performance and the success with ES8 and L90 as it is actually drawing the effort of our competitive technology roadmap, reasonable product planning as well as more precise product definition and the market insights that can fit for the users’ needs in the Chinese market. And in terms of the supply chain, this is also playing a very important role in achieving the long term competitiveness of our product cost structure by establishing a win cooperation with our partners.

And in the past one or two years, we’ve also made adjustments to our supply chain and the partner strategy. In general, we look for the partners who believe in the roadmap technology decisions of the company as well as believe in the long term potentials of the company. And we work closely with these partners to jointly define the cost of targets and all types of targets. So for the existing products and also the coming platforms, we will also adopt this principle in our nomination and the sourcing strategy to be able to work with our partners closely.

Stanley Qu: Thank you, Tianjin.

Operator: Thank you. Your next question comes from Ming-Hsun Lee from Bank of America. Please go ahead.

Ming-Hsun Lee: Thank you, Wei Lin, and congrats for the good results. I also have two questions. So my first question is, could you confirm your new model pipeline for 2026? Can I confirm there will be at least five new car, which include ES6, ES7, ES9, L80 and also the second model under the Firefly brand?

William Li: Regarding our product strategy for 2026, as we’ve mentioned, we will focus on three large SUV models for the Envoy and also the new brand. Regarding the ET5, ET5T, ES6 and ES6, as this year we have just upgraded these four models to the model year 2025. For next year, we don’t have major plans to upgrade or facelift these four models. As on the model year 2025, we’ve already upgraded interior, exterior, the smart system is also upgraded to the latest C. S platform with both upgrade in the smart driving chip as well as the operating system. And recently we have also announced to make 100 kilowatt hour battery as a standard configuration on these four models.

We believe that with all these changes the competitiveness of these four models will continue to be strong in the coming quarters. Of course, it doesn’t mean that we will make zero changes to this model. We will still roll out some product calendars as this year earlier this year we have released the Champion Edition for the five and the six series and in the coming year we will also have such special versions and additions for these models. And also for the Firefly brand, we don’t have a plan for the second model next year.

Ming-Hsun Lee: Thank you, William. And my second question is regarding to the operating expense control. So in 2026, what level do we expect for your R and D expense per quarter? Do you think you can maintain around RMB2 billion non GAAP R and D expense per quarter? And also, could you guide your latest CapEx plan for 2025 and 2026? Thank you.

William Li: Regarding the R and D expenses, starting this year we’ve made major efforts based on the CPU mechanism improving our R and D efficiencies and the overall ROI of our R and D activities and investment. For the next year, our quarterly R and D expense non GAAP will be around RMB2 billion to RMB2.5 billion per quarter. That is a reasonable range for us to also maintain our long term competitiveness from the technology perspective. The major liabilities comes from the new model development as we believe that the investment for the foundational level R and D activities and technologies are mostly finished.

And also regarding the CapEx as we haven’t started the operational target discussion and the setting for the next year, I may not have a very clear or precise outlook regarding the CapEx for 2026, but I can share with you two principles we have. The first is regarding the power swap network. In general, we still hope to leverage as much as possible the Huffman’s resources and for the Power Swap network construction. And regarding the R and D CapEx and it’s well, regarding the CapEx on the product, it’s mainly dependent on the overall R and D cadence and also go to market strategies of the new models.

Overall speaking for next year, we hope the CapEx can be similar to the level of this year or if possible achieve even better results next year. But as I’ve emphasized, it’s highly dependent on the overall launch cadence and also R and D cadence of the new models.

Operator: Thank you. Your next question comes from Paul Gong from UBS. Please go ahead.

Paul Gong: Thanks William for taking my question. My first question is regarding the impact of the 100 kilowatt hours of the battery that you are going to adopt across new brands. Can you share with us the financial impacts of this strategy? Definitely, we can see that the competitiveness of the vehicles are getting enhanced because of this 100 kilowatt hours of the battery. But what would be the incremental costs on your front? Thank you. This is my first question.

William Li: Thank you for the question. When we announced the policy changes on the 100-kilowatt-hour battery pack, we’ve already introduced the potential impact or implications on the financials of the product. As when we launched the model year 2025 product, we offered a series of special offers and discounts to our users together with the products. And this time when we make the 100-kilowatt-hour battery standard configuration of the five and the six series, we actually withdraw many of these offers we provided at the launch of the product. And in exchange, we offer the 100-kilowatt-hour battery as a standard configuration.

So from the transactional perspective, there is no major change from the users perspective as well as from the vehicle margin perspective, there is also no major impact. And another impact is more on the sales and the upper funnel of our sales leads for the five and six series after announcing the change on the 100 kilowatt hour battery. We actually observed increases in the upper funnel incoming leads. Of course, this is a newly launched policy in terms of the long term implication, we will still need some time to observe, but overall impact is more positive than negative.

Paul Gong: Okay. So my second question is regarding the impact of switching to your self developed chips. Just now I think William mentioned that it is saving cost and it is also depending on the volume because of the fixed cost versus the volume. So can you give us some color that, for example, if you are delivering 20,000 per month with a new self developed chip, what would be the cost saving on the per car basis If this volume is coming to 50,000 per month, what would be the positive impacts from the cost saving angle due to the switching of the self developed chips? Just want to have the better estimate and sensitivity on that. Thank you.

William Li: Thank you for the question. Regarding the chip R and D expenses and investment as we actually recognize that in our immediate financials and the P and Ls, so it’s actual cost of savings per unit is not really closely tied in the actual volume we sell or actual number of the pieces we sell. As in terms of the production of these chips, we purchased the wafers directly from our chip manufacturing partners. So in that case, cost of saving per unit through the in house developed chip is not tied into the delivery volumes we achieve.

But in comparison to the chip solution we used on the second generation products, achieving the same level of computing performance, the cost is actually more advantageous and competitive with our own solution. And even on the third generation in comparison to the industry flagship smart driving chips, we still have a cost advantage and the competitiveness with our in house solution. But here I will not elaborate on the specific savings achieved per piece.

Paul Gong: Okay, I understood. That is very helpful. Thank you.

Operator: Thank you. Your next question comes from Yuqian Ding from HSBC. Please go ahead.

Yuqian Ding: Thank you, team. The first question would be more exploration on the pricing side. So ES8, L90 attractive pricing, good volume traction. So how does management would evaluate the potential internal cannibalization to the existing portfolio such as ES6 or L60 and the potential splash impact into next year’s new model pipeline?

William Li: As we’ve mentioned, the pricing of strategy for a product is highly dependent on the market competition, the cost structure of the product as well as the volume and the pricing sensitivity of the product in the segment. For the L90 as we’ve mentioned with its launch actually it has helped boosted the sales volume of L60. Right now even for the L60 users they will have to wait for the new cars deliveries and pickup. Actually in August, we even achieved a new high for the order intake of L60 for this year. So the overall impact from L90 on L60 is positive.

Regarding And the all new ES8, as we’ve also mentioned, we have now made the 100 kilowatt hour battery as standard configuration on the five and six series. So the attractive pricing of ES8 is helping boost the brand awareness of the new brand, which can also introduce more attention to the five and the six series. So with this logical and clear pricing system set up for the brand, we believe that the overall impact will also be positive on the new brand. Maybe at the beginning, our fellow will struggle with how to allocate their focuses at the time across different products.

But for the long term, we believe that the impact of these two models and the new models will be positive across the brands and the products. And also as we see strong demand for the Onui S8 and L90, we have also observed the successful product or great product great large three row battery electric SUV models launched not only by NIO, but also by our competitors who used to have only with products in the market. So with all these large three row SUVs coming to the market, we also observed a market trend in the first half of this year.

The growth rate of BAB segment increased by 39% year over year and for RIBS that’s only 14%. If we consider about the sales volume in July and August for the BAF and the RAV respectively, I believe that the growth rate of the BAF will be even faster than that of RAV. In that case, are observing growing competitiveness of the products in the mid and the mid large battery electric SUV segments as this is more well received and also evident to the public.

This is why we say that the golden era of the large fair role battery electric SUV is arriving as with more mature user mindset and also stronger competitiveness of the product, the market is shifting towards that direction. This will also help the long term competitiveness and the popularity of our existing SUV models including ES6 and L60.

Stanley Qu: Thank you, Richard.

Yuqian Ding: Yes, got it. Thank you. The second question is a little bit more exploration on OpEx side. You touched upon the innovation redesign and R and D commitment. So could you give us a little bit more quantification and breakdown in terms of the OpEx cuts target, if there is any? Or just breakdown the cost optimization initiatives seeing a little bit more details? Thank you.

William Li: Thank you for the question. As we’ve introduced towards the Q4 non GAAP breakeven target, our overall principle is that for the R and D expenses without compromising on the major R and D activities and also long term competitiveness, we would like to control the quarterly R and D expenses to be within RMB2 billion for this year and for SG and A ratio to the sales revenue around 10% this year. That’s our target for this year towards the quarterly breakeven.

And for the long term, as we’ve also mentioned, for the year of 2026, our R and D expenses will be around RMB2 billion to RMB2.5 billion per quarter depending on the product go to market and also development cadence. And as for the SG and A expenses, we would like to continue to achieve higher efficiency and utilization of expenses. That’s the overall principle.

Stanley Qu: Thank you, Yuxin.

William Li: Thank you.

Operator: Thank you. Your next question comes from Tina Hou from Goldman Sachs. Please go ahead.

Tina Hou: Thanks management for taking my question. Just a very quick one. So in the longer term, how should we think about the stabilized sales volume of L90 as well as ES8 on a like average monthly basis? Thank you.

William Li: Thank you for the question. As the automotive industry here in China is highly competitive and if you look at the sales trend of the smart electric vehicles, you seldom see any new model that can capture a very stable market share and very major trend or popularity in the market for a very long time. In that case, it’s also difficult for us to really share with you a clear outlook regarding what the stabilized sales volume of the ES8 and L90 will be for the long term. But definitely, we set ourselves a higher target and we will also try the best.

Starting this year for the new and ARMOR brand, we also started to build up the team capabilities by implementing a completely new sales and marketing paradigm. We hope that through this new sales and marketing paradigm, it can actually help us to maintain and capture the market share of our new models as soon as possible to prolong their impact and influence in the market and also to stabilize their winnable and satisfying sales volume in the market against the fierce competition as long as possible.

But as we have just implemented this paradigm and it will also take time for us to understand if it is truly helping us with the stabilization of these two great models ES8 and L90. But overall, we hope that this can achieve a good result that is satisfying to the market, investors and also our users.

Operator: Thank you, William.

Rui Chen: Thank you. As there are no further questions now, I’d like to turn the call back over to the company for closing remarks.

Rui Chen: Thank you again for joining us today. If you have any further questions, please feel free to contact NIO’s Investor Relations team through the contact information on the website. This concludes the conference call. You may now disconnect your lines. Thank you.

Source link

What Is One of the Best Quantum Computing Stocks to Buy Now?

This business boasts quantum computing strengths that others lack.

The hot field of quantum computing catapulted the stocks of several companies in the space. Examples include IonQ (IONQ -3.04%) and D-Wave Quantum (QBTS -2.24%). The former’s share price is up over 400% and the latter more than 1,000% in the last year through the week ending Aug. 29.

But of the businesses racing to produce quantum computers capable of adoption beyond research circles, Nvidia (NVDA -3.12%) stands out. Several factors contribute to its position as a top quantum computing stock to consider right now.

The words

Image source: Getty Images.

Why Nvidia is a compelling quantum computer stock

Nvidia is known as the artificial intelligence (AI) semiconductor chip leader. But as it looks toward the future, the company is working to evolve its tech for the quantum era. For example, it’s developing a core processing unit that works in a quantum computer.

In addition, Nvidia is opening a research center that will house “the most powerful hardware ever deployed for quantum computing applications,” according to the company. The center aims to solve challenges inherent in quantum devices, such as their propensity to make computational mistakes.

Beyond its tech, another factor making Nvidia a compelling quantum computer stock is the company’s outstanding financial health. While IonQ and D-Wave aren’t profitable, Nvidia’s net income was $26.4 billion in its fiscal second quarter (ended July 27), a 59% increase over the previous year. It also generated $13.5 billion in Q2 free cash flow, providing funds to invest in quantum technology.

Moreover, Nvidia shares possess a superior valuation among quantum computer stocks such as IonQ and D-Wave. This can be seen in the price-to-sales (P/S) ratio of the companies.

NVDA PS Ratio Chart

Data by YCharts.

The chart shows that IonQ and D-Wave’s sales multiples skyrocketed over the last year, making Nvidia the lowest among the trio by a wide margin. This suggests IonQ and D-Wave stocks are overpriced.

With its better valuation, technological advancements, and strong financial standing, Nvidia emerges as an attractive investment in quantum computing.

Source link

These Were the 2 Top-Performing Stocks in the S&P 500 in August 2025

In both cases, unexpected headlines did most of the heavy lifting.

When all was said and done, last month ended up being a decent one for the broad market. The S&P 500 (^GSPC -1.44%) ended August 1.9% above where it started. For a couple of S&P 500 stocks, however, the month was far better.

Chemical company Albemarle (ALB -6.28%) was August’s biggest S&P 500 winner, up a little more than 25% after China’s Contemporary Amperex Technology Company shut down operations at one of the world’s biggest lithium mines. Since Albemarle also owns and operates lithium mines, a diminished supply of the metal used to make electric vehicle batteries creates greater demand for Albemarle’s products.

That being said, the stock had the advantage of hitting the ground running early in the month. Albemarle’s second-quarter sales of $1.3 billion and non-GAAP (adjusted) per-share income of $0.11 reported at the very end of July were both better than expected, while the bottom line was considerably better than analysts’ estimates for a loss of around $0.84 per share.

An excited middle-aged man sitting at a desk looking at a laptop.

Image source: Getty Images.

Shares of S&P 500 constituent and health insurer UnitedHealth Group (UNH 0.36%) rallied a little more than 24% last month, mostly in response to news that Warren Buffett’s Berkshire Hathaway had taken on a stake in the beaten-down stock.

Just keep the move in perspective. The stock’s still down 48% from April’s peak thanks to the 60% sell-off from that high to the multiyear low hit in early August following a disappointing first-quarter report and subsequent reductions for its full-year earnings outlook. The company’s now only looking for 2025 earnings of “at least $16.00” per share, well down from guidance of between $29.50 and $30.00 per share as of the end of last year. Unexpectedly high costs (particularly for its Medicare Advantage plans) are the chief culprit.

While both gains are impressive, in and of themselves, they aren’t reason enough to step in. You’ll still want to be sure these companies are actually worth owning before buying into either of them.

James Brumley has no position in any of the stocks mentioned. The Motley Fool has positions in and recommends Berkshire Hathaway. The Motley Fool recommends UnitedHealth Group. The Motley Fool has a disclosure policy.

Source link

Dentsply Sirona (XRAY) Q2 2025 Earnings Transcript

Logo of jester cap with thought bubble.

Image source: The Motley Fool.

DATE

Thursday, August 7, 2025 at 8:30 a.m. ET

CALL PARTICIPANTS

Chief Executive Officer — Daniel T. Scavilla

Chief Financial Officer — Matthew E. Garth

Need a quote from a Motley Fool analyst? Email [email protected]

RISKS

Goodwill and Intangible Asset ImpairmentDENTSPLY SIRONA(XRAY -4.13%) recorded a $214 million noncash after-tax impairment charge for goodwill and other intangibles within the OIS and CTS segments in fiscal Q2 2025 (period ended June 30, 2025) (GAAP), attributed to tariffs and volume changes that diverged from initial investment assumptions.

Tariffs— CFO Garth disclosed an annualized gross tariff impact increase from $50 million to $80 million for fiscal year 2025, with $25 million expected to affect 2025 earnings as costs roll through fiscal Q3 and Q4.

U.S. Revenue Decline— U.S. segment sales fell 18% in fiscal Q2 2025; excluding Byte, the decline was 11% (non-GAAP), primarily due to weakness in connected technology solutions and orthodontic and implant offerings.

Cash Flow Decrease— Operating cash flow dropped to $48 million, compared to $208 million in the prior year quarter, mainly due to the timing of cash collections, inventory build, and the absence of a $42 million foreign tax refund received in fiscal Q2 2024.

TAKEAWAYS

Revenue— $936 million, down 4.9% as reported and 6.7% on a constant currency basis for fiscal Q2 2025, with half the decline from Byte.

Adjusted EBITDA Margin— Adjusted EBITDA margin was 21%, up 360 basis points versus the prior year, driven primarily by Byte impact and cost reductions.

Adjusted EPS— Adjusted EPS was $0.52, representing 7% year-over-year growth, attributable to margin expansion, FX, and lower share count, partially offset by higher taxes and below-the-line items (non-GAAP).

Cash and Cash Equivalents— $359 million at quarter end, with a net debt-to-EBITDA ratio of 3.1x (non-GAAP), unchanged sequentially.

Hybrid Bond Offering— Completed a $550 million raise, improving financial flexibility.

EDS Segment— Sales rose 1.1% in constant currency, led by Rest of World, offsetting lower volumes in Europe and the U.S.

OIS Segment— Sales (non-GAAP) dropped 19.4% in constant currency. Byte comprised more than half, and value implants were down low double digits.

CTS Segment— Sales fell 5.9% in constant currency; double-digit European imaging growth offset by declines in U.S. CAD/CAM and imaging (non-GAAP).

Wellspect Healthcare— Sales declined 2.5% in constant currency (non-GAAP), reflecting prior-year dealer stocking and new product launches.

SureSmile— Delivered 3.3% year-over-year global growth, with strong European and Rest of World results partially offset by softness in the U.S.

Germany— Marked a fourth consecutive quarter of growth, driven by CTS and SureSmile expansion; offset by IPS weakness.

Outlook— Full-year 2025 sales, adjusted EBITDA margin, and adjusted EPS (non-GAAP) guidance reiterated. Fiscal Q3 sales and adjusted EPS are expected to decline sequentially due to tariffs and seasonality.

DS Core Platform— Reached 50,000 unique users, with increasing device connectivity and lab orders processed monthly.

Field Investment— CEO Scavilla committed to enhancing field team support, customer focus, and proceduralization as strategic imperatives.

SUMMARY

Management confirmed a strategic shift toward customer-centric execution, emphasizing field enablement and operational streamlining to support margin enhancement despite top line pressures. The company is actively accelerating innovation and procedural offerings, with DS Core adoption highlighted as a central element of the growth strategy. Investments in sales force capabilities and prioritized capital allocation aim to strengthen competitive positioning and free up resources for sustained innovation.

CFO Garth said, “The year-over-year decline is primarily attributable to the timing of cash collections, a higher build of inventory in anticipation of ERP go-lives and tariffs, and an approximately $42 million foreign tax refund received in the prior year quarter [fiscal Q2 2024].”

CEO Scavilla confirmed active engagement with distribution partners, noting an intention to “listen and learn” before determining long-term channel strategy.

Segment-level results (non-GAAP) demonstrate relative stability in Europe and Rest of World compared to pronounced U.S. sales compression, with Germany sustaining positive momentum amid global variability.

No significant distributor inventory shifts impacted revenue year-over-year, according to CFO Garth.

Management aims to offset emerging tariff costs and macro softness through ongoing cost controls, focused investments, and procedural innovation, pending further review under new leadership.

INDUSTRY GLOSSARY

Byte: Direct-to-consumer clear aligner business, referenced in segment and revenue discussions related to orthodontics.

CTS: Connected Technology Solutions, a segment encompassing digital imaging, CAD/CAM equipment, and related dental technologies.

EDS: Essential Dental Solutions, a segment covering endodontic, restorative, and preventative dental products.

SureSmile: A DENTSPLY SIRONA clear aligner solution for orthodontic treatments; performance is reported within OIS and by region.

IPS: Implant Prosthetic Solutions, referencing dental implant and prosthetic product lines within the OIS segment.

DS Core: Company-developed digital platform integrating devices, data, and workflows for dental professionals.

VBP: Volume-Based Procurement, a purchasing model in China impacting implant sales volume and pricing.

Hybrid bond: A subordinated debt security combining debt and equity features, used to bolster liquidity and financial flexibility.

Full Conference Call Transcript

Dan Scavilla, Chief Executive Officer; and Matt Garth, Chief Financial Officer. I’d like to remind you that an earnings press release and slide presentation related to the call are available in the Investors section of our website at www.dentsplysirona.com. Before we begin, please take a moment to read the forward-looking statements in our earnings press release. During today’s call, we may make certain forward-looking statements that reflect our current views about future performance and financial results. We base these statements and certain assumptions and expectations on future events that are subject to risks and uncertainties.

Our most recently filed Form 10-K and any updated information in subsequent Form 10-Q or other SEC filings list some of the most important risk factors that could cause actual results to differ from our predictions. On today’s call, our remarks will be based on non-GAAP financial results. We believe that non-GAAP financial measures offer investors valuable additional insights into our business’ financial performance, enable the comparison of financial results between periods where certain items may vary independently of business performance and enhance transparency regarding key metrics utilized by management in operating our business. Please refer to our press release for the reconciliation between GAAP and non-GAAP results. Comparisons provided are to the prior year quarter unless otherwise noted.

A webcast replay of today’s call will be available on the Investors section of the company’s website following the call. And with that, I will now turn the call over to Dan.

Daniel T. Scavilla: Thank you, Andrea, and good morning, everyone. This is my first earnings call since taking the CEO role on August 1. So I thought it would be appropriate to open with a few statements before progressing into the Q2 business results. Then Matt will cover Q2 financials and give an update on our 2025 outlook. First, I want to thank Simon for his nearly 3 years in the role, where he built a strong team, strengthened communications with our customers and initiated multiple programs to improve DENTSPLY SIRONA’s position in the market.

Having come from our Board of Directors, I can tell you that I personally appreciate the work he’s done, and I plan to build on these programs with an eye on moving deeper, faster and strengthening our long-term position in the market. Second, I look forward to partnering with Matt as our new CFO. I believe Matt’s experience and background are exactly what we need, and we’re forming a strong partnership as we move forward together. I’ve also had the opportunity to engage with senior leadership at DENTSPLY SIRONA, and my initial assessment is that we have the core foundation to shape this company’s future.

I’m sure many of you are wondering what I plan on doing and what changes you should expect from me. While I do have several hypotheses and ideas on what to focus on, I’m currently working with the team and our customers to listen and learn so we can prioritize and focus our approach before fully developing pathways. There are a few areas that are immediately apparent that I’ll share with you now, starting on Slide 3. I’ve been focusing initially on providing stability to the organization through the CEO change, so we can focus on execution and drive results.

I’ve been active with the DS team connecting, interacting and conducting deep dives to listen, learn and align on our go-forward approach. We will continue to improve our focus on the customer and the customer experience. Every position in every department will make this a priority. We will enhance our support of the customers and our field-based employees through simplifying interactions, speed of response and increased strategic investments. The field team is and will become even more so a strength of our company, the tip of our spear.

We will focus on enhancing investments in innovation, including speed to market and adding value to our clinicians and their workflows so that they can offer the best products and services to their patients and grow their skills and practices. As market leaders, we will need to shape the future of our markets, partnering with our practitioners to migrate from product offerings into proceduralization, focusing on the complete provider patient experience, leveraging the strength of our entire company’s broad portfolio to outpace competition. DS Core platform is a critical element of the company’s strategy, and it continues to gain traction with 50,000 unique users now using the platform and more connected devices and lab orders processed each month.

We have a strong supply chain under great leadership that I believe we can enhance even further through streamlining several components to unlock value, reduce cost and free funds to invest in fueling future growth. As you’ve heard from us, we have programs underway that will continue, but we’ll also be looking at more strategic moves to better position ourselves for the future. Wrapped around our commercial enablement, innovation engine and operations muscle will be streamlined support functions that will add value through simplifying and standardizing systems, processes and structure that will allow us to move faster support customers better and unlock funds that can be redirected into sustained profitable growth.

The team has made progress here as seen in our financial results, but there’s more work to do in this area. I believe that focusing on the customer, moving with urgency, while investing in our sales team and product development capabilities will unlock value throughout our P&L. We will make decisions to support long-term sustained growth that leads to stronger financial performance, benefiting our business and our shareholders. Moving into our Q2 business results on Slide 4. Global sales were $936 million, decreasing 5% as reported or negative 7% on a constant currency basis. Excluding the Byte impact, sales declined approximately 4%. Adjusted EBITDA margin was 21%, increasing 360 basis points versus prior year Q2.

Adjusted earnings per share were $0.52, growing 7% versus prior year. Both adjusted EBITDA and EPS results are driven primarily from Byte impact and active cost reduction programs. Cash flow from operations was $48 million for the quarter. Our data and customer survey in the second quarter show global patient volumes and procedures largely unchanged from previous quarters. From a regional perspective, U.S. sales in Q2 were $293 million, down 18% in total or 11%, excluding the Byte impact. Results were driven primarily by continued softness in connected technology solutions and orthodontic and implant solutions. Given the performance, this is a priority area for us to address. We’ve already kicked off activities in my first week.

European sales were $404 million, basically flat versus Q2 prior year. Germany delivered its fourth consecutive quarter of growth, driven by CTS and SureSmile, which was up over 27%, offset by softness in IPS. Rest of World sales were $239 million, up slightly versus prior year with growth in Essential Dental Solutions and SureSmile up double digits, partially offset by softness in CTS. Before I hand the call to Matt, I want to say that I’m excited to join the DENTSPLY SIRONA team and be part of shaping the future of this organization.

I believe our potential has never been greater, but it’s up to us to harness our resources and shape the future of our markets, placing our customers at the center of all we do and making thoughtful investments to drive long-term sustained profitable growth. Thank you. I will now turn the call over to Matt.

Matthew E. Garth: Thanks, Dan. Hello, everyone, and thank you for joining us. As Dan noted, it’s early days for us, but we are working closely together and share the belief that DENTSPLY SIRONA’s potential has never been greater than it is now. Since joining DS, my priority has been helping the team focus on value-accretive activities. There is very strong engagement across the company in this regard, and Dan’s arrival is helping to further our efforts and increase our pace. Our areas of immediate focus are fully aligned and currently being actioned. First, customer experience. We are directing our firepower to establish the best outcomes for customers through service and innovation. Second, margin enhancement.

We are raising the speed of transformation by eliminating waste throughout our operations and focusing the organization on value-accretive actions. And lastly, capital allocation. We are taking a disciplined approach and making appropriate investments to deliver increasing rates of return and shareholder value. And now let me turn to our second quarter results and a review of our full year 2025 outlook. Let’s begin on Slide 5. Our second quarter net sales were $936 million, representing a decline of 4.9% versus the prior year quarter and a 6.7% decline on a constant currency basis, of which roughly half was due to Byte.

Adjusted EBITDA margins expanded 360 basis points to 21.1%, benefiting from the suspension of Byte sales and lower operating expenses. Despite lower sales, adjusted gross margin expanded 60 basis points to 55.9%. Adjusted EPS in the quarter was $0.52, up 6.6% from prior year largely due to higher adjusted EBITDA margins, FX and a lower share count, partially offset by below-the-line items and a higher tax rate. As you will have seen, we recorded a roughly $214 million noncash after-tax charge related to the impairment of goodwill and other intangible assets within the OIS and CTS segments. These impairments were driven by the impacts of tariffs and current period volume changes relative to the initial investment thesis.

In the second quarter, we generated $48 million of operating cash flow compared to $208 million in the prior year quarter. The year- over-year decline is primarily attributable to timing of cash collections, a higher build of inventory in anticipation of ERP go-lives and tariffs along with an approximately $42 million foreign tax refund received in the prior year quarter. We finished the quarter with cash and cash equivalents of $359 million. Our Q2 net debt-to-EBITDA ratio was 3.1x and flat on a sequential basis. We also completed a $550 million hybrid bond offering in Q2, which helped to increase our ongoing financial flexibility. And now let’s turn to second quarter segment performance beginning on Slide 6.

Starting with EDS, which includes Endo, Resto and preventative products, sales on a constant currency basis increased 1.1% with growth in the rest of the world, partially offset by lower volumes in Europe and the U.S. It’s worth noting that EDS performance in the quarter reflected stable patient traffic across our major markets, a good indicator of the relatively stable environment and consistent with our customer surveys. Shifting to OIS. Sales in constant currency declined 19.4% with Byte accounting for over half of the decline. IPS declined double digits in the quarter, driven by lower lab volumes globally and lower implant sales in the U.S. and Europe, which were partially offset by growth of implants in China.

SureSmile continued to make solid gains, rising 3.3%, driven by strong performance in Europe and Rest of World, partially offset by softness in the U.S. Turning to CTS. Sales in constant currency fell 5.9% versus the prior year quarter as double-digit growth in imaging in Europe was more than offset by declines in CAD/CAM and imaging in the U.S. Note that changes in distributor inventories did not impact the comparison of CTS sales year-over-year. Moving to Wellspect Healthcare. Sales in constant currency declined 2.5%.

As expected, year-over-year results were negatively impacted by a U.S. dealer initial stocking order, which occurred in the prior year period and had an approximately 4.5% negative impact, which was partially offset by the benefit of new product launches. We continue to expect this business to deliver mid-single- digit growth for the full year. With that, let’s move to Slide 7 to discuss our updated outlook for 2025. We are maintaining our full year 2025 outlook for sales, adjusted EBITDA margin and adjusted EPS.

Now looking to the third quarter, on a sequential basis, reported sales are expected to be down slightly, following normal seasonality, while adjusted EBITDA margin is expected to decline due to tariff-related costs beginning to roll through the P&L. We expect that these factors, combined with a higher tax rate, will result in sequentially lower adjusted EPS. This outlook helps us maintain our full year projection and a relatively balanced first and second half of the year. Before we wrap up, I’d like to share an additional thought on capital allocation. We believe that DENTSPLY SIRONA has the potential to yield sustainably high levels of free cash flow.

Effort is underway to work down inventories and reduce our overall working capital requirements. We plan to prioritize investments in innovation and growth, financial flexibility and returns to shareholders. And now let me summarize on Slide 8. In the second quarter, our top line continued to be challenged. However, we delivered adjusted EBITDA margin expansion and adjusted EPS growth through continued financial discipline. We’re maintaining our full year outlook for sales and adjusted EPS. We’ve added flexibility to our balance sheet, and we are actively working to enhance our cash flow generation. We see significant untapped opportunity at DENTSPLY SIRONA. Unlocking it starts with taking a value-creation- oriented approach to financial management, and that work has already started.

We believe combining this approach with the customer experience transformation underway at DS will allow us to yield greater results faster, and we look forward to sharing our proof points in the coming quarters. With that, let’s open it up for questions.

Operator: [Operator Instructions] Our first question comes from Elizabeth Anderson of Evercore ISI.

Elizabeth Hammell Anderson: Welcome, Dan and Matt. There’s obviously lots going on in terms of some of the product changes and you guys are new and things like that. I was wondering if you might be able to give us a little bit of like a state of the union as you see the broader overall dental market, so we can kind of set out what you’re seeing on that level and then obviously some of the specific, like idiosyncratic factors that you were discussing on top of that?

Daniel T. Scavilla: Thanks for the question, Elizabeth. This is Dan. And so I’ll give you my perspective of being 5 days in the seat here and go at it that way. But just using data that we have and that we’ve talked about, the Q2 survey in particular, which we found consistent with the ADA survey saying that patient volumes remain stable. Procedural utilization in the electives like implants and ortho continue to be soft. And we see some shifts but nothing meaningful. Maybe Germany, the dentist sentiment looks like it’s slightly better. Tough to call, right? You have a lot of activity on the macro with tariffs and activities that fluctuate every hour.

I think the real thing is remain focused on the patient and the chair and the dentist, give them the right products and drive this. When you do that the right way, all those other things can soften out. Our thought is focus on the long term and not react to the short-term noise that’s out there. So that’s really where we’re headed.

Elizabeth Hammell Anderson: Got it. That’s very helpful perspective, and makes sense. Maybe just as a follow-up, anything to call out in terms of distributor stock- ups or destocking dynamics in the quarter, maybe particularly in CTS and EDS? That might be more a question for Matt.

Matthew E. Garth: Yes, it is. This is Matt. Again, we said in the prepared remarks that we really didn’t see a significant revenue impact on a year-over- year basis related to stocks at dealers. And in fact, when you look at it on a year-over-year basis, they’re, both on an imaging basis and on a CAD/CAM basis, in a good healthy position and the deltas year-over-year were pretty similar. So feeling good about the overall stock situation.

Operator: Our next question comes from David Saxon of Needham & Company.

David Joshua Saxon: Dan, maybe I’ll start with a higher level question for you, and nice talking to you again on a DENTSPLY call. So just wanted to understand kind of what about the opportunity at DENTSPLY motivated you to switch over and then with backgrounds in spine, most recently in vision care and other areas at J&J, anything you learned in those markets that might be particularly useful as it relates to DENTSPLY’s positioning in dental and how you’re thinking about profitability?

Daniel T. Scavilla: Yes. Thanks for the question, David. And it’s good to connect with you in another part here. So I look forward to going forward with you. There’s a couple of things. Globus is such a great company, and there’s such a great learning there, followed by, as you said, the breadth of moving around the different things with J&J. What I saw at DENTSPLY is the opportunity to honestly apply all of those. And I think it’s more about the operational experience and the execution coming from those and bringing it in here that I think would be what interested me most. And there’s a lot of areas to focus on.

I think the vast majority, I’ve had my hands in, in the past, and I think I can apply and help the team. And so for me, it’s about taking my experience, helping what I think is truly a great team, accelerate to get where we need to get to.

David Joshua Saxon: Great. And then as my follow-up, I wanted to ask on implants. So maybe you can give a little more color on how that part of the portfolio did both geographically and then across premium and value. And then in the script, you talked about it being a priority area and already had some initiatives going. So can you give me — give a little more color there? Like what exactly are you doing in that part of the business? And how should we think about the impact they might have?

Matthew E. Garth: Yes. And the implant story continued this quarter from what you have seen earlier in the year, where we’ve seen slower legacy brands transitioning to our new products, particularly as we looked at the premium side of the business. On the value side of the business, the Middle East volatility, I think you know that we produce a lot of our value implants in that region, and so the volatility there did impact our volumes with the limitations on being able to get product out of certain countries and into other countries, but that should be passed as we move forward.

From a headline perspective, we saw a premium down about 5%, and that is due to the exchange that we are seeing as we roll out the new products and the shift from legacy brands. We do expect for the full year that we are going to have some growth expected because of the sales force changes that we’ve made and that we talked about and what Dan just spoke to in terms of driving some new consumer experiences, and then also from the China VBP program that we’ve seen so far this year, that should carry us. From a value perspective, Q2 was down, let’s call it, low double digits.

And again, largely due to what was taking place in the Middle East, and that will carry through for the full year as we look forward. But overall, the big driver, as we’re looking at implants, has been from the lab side of the house, and so we expect to see that continue through EMEA and the U.S., both in the quarter and then over the year.

Operator: Next question comes from Kevin Caliendo of UBS.

Dylan Christopher Finley: Welcome, Dan and Matt. This is Dylan Finley on for Kevin. To start, just wondering, if you could maybe reframe some of your tariff assumptions for the year. I believe, previously, the team had sized at about $50 million in annual costs per year. So wondering if there’s any changes around that? And then second of all, does the guide contemplate any mitigation efforts and any kind of supply chain action or price action you can talk about there?

Matthew E. Garth: Yes. Let me start with the activities that the teams are driving today, which have been extremely good results on expense control and driving efficiencies through the supply chain organization. You see that showing up in our margin as we speak. Last quarter, we told you that we were expecting about a $50 million annualized impact from tariffs. What has happened over the past couple of weeks with Europe and with Switzerland and Sweden has showed us that, that has grown to about $80 million that we were looking at on an annualized basis. So the interesting thing there for 2025 is that we have a similar situation on the $25 million that we spoke about last quarter.

The puts and takes and the timing impacts that we’ve seen are going to result in the same level of impact here in 2025. So that $25 million roughly spread across Q3 and Q4. The mitigation factors, we continue to look at ways, including cost savings, including activities that we are driving towards finding initiatives and finding mitigation efforts. And I think that will continue through the end of this year, and we’ll look hard at what we’re going to do for 2026.

Dylan Christopher Finley: And then on orthodontics, quick clarification. Did you see any adjustments or kind of chargebacks on Byte? I know last quarter, there was like a reverse of some of the refunds. It was a bit of a positive. So just wondering if there’s any adjustment there on Byte. And then second of all, just quickly, if you could talk about SureSmile and what you’re seeing in the U.S. today. One of your competitors called out challenging conversion rates, a potential shift to wires and brackets from orthodontists. Just any commentary you can provide on that market?

Matthew E. Garth: Yes. So the assumptions that we put into place, as you know, you saw last quarter around Byte and what’s happening there, the patient load has come off faster. We did see about a $4 million adjustment here in the second quarter. For the second half of the year, we now believe we are in line appropriately with the rates of the drop-off. So not anticipating any further changes in that assumption. As you look at SureSmile, again, we said good performance, 3.3% growth on a year-over-year basis. The U.S., like many other areas that we are seeing in the U.S., there is a little bit of a drag there.

The things that we are doing to try and drive change, education programs, working with our sales force and driving new ways of working specifically with specialists and orthodontists, that’s what you will see help us drive a change in the U.S.

Operator: Our next question comes from Michael Cherny of Leerink Partners.

Michael Aaron Cherny: This might be getting a little ahead of ourselves, but maybe tying back a little bit to what Elizabeth asked off the top. She talked about the end market. I’d love to talk internally about how you see the portfolio, Dan, as you settle in. Obviously, we have the Wellspect review going on, but how do you see the rest of the portfolio? And relative to the business, do you feel at this early point in time like there are areas where you have holes that you want to pursue? And how do you think about the build of inorganic versus organic growth along that front? It might be a philosophical question, but thought I’d at least start there.

Daniel T. Scavilla: No problem, Mike. I appreciate the question. So there’s a couple of things. I actually believe that no one else is better suited to compete holistically in this market than DENTSPLY SIRONA. We have everything that we need to do this and drive it. It’s about focus and execution. I don’t think there’s major gaps that are out there and any minor gaps, I think you’ve got an incredible innovation engine seriously that is working on those things. Should we do it faster? Can we penetrate deeper? The answer is, of course. And that will always be it, no matter what the performance is that way.

But the potential and when I talk about unlocking the potential, it’s about using every single thing that we have to impact further than what we’ve been doing. And I think that’s really it that way where it comes. Organic versus inorganic, the answer is both. I lean more towards the organic because I think you build the right in-house capabilities and right productions. And you can actually do that in usually a more profitable way, eliminate unnecessary impairments and other external costs. But opportunistically, when we have a strong cash flow, the ability to buy and accelerate speed, of course, is something that we’ll consider and do at the appropriate times.

Michael Aaron Cherny: Got it. And then just one more on implants, if I can. As you think about the market, I know that under the previous leadership team, there was a major focus on reinvigorating various different areas of growth. How do you feel about where those pieces of the reboot on implants fit as you settle into the seat? Again, I know these are early questions, but just trying to get a sense of some of the key trends we should expect going forward.

Daniel T. Scavilla: No, I appreciate your positioning with it. Listen, I think the following. I think the team is moving in the right direction in several areas. I haven’t come in and said we’re changing this, we’re making a radical shift. And what I don’t want to do is create a disruption that actually slows us and puts us at a temporary competitive disadvantage. I will continue to look. I might change my opinion as I go deeper in my listen and learn sessions. But to date, while I’ve seen the things that are in progress, I think I’m going to keep them in progress. I want to go deeper and faster in a lot of the areas.

I probably won’t be as specific and focused in key areas. I think all of these are meaningful areas for us, and I want to see growth and health in all of them. How we do that, in which you order and prioritize what do we do that? Let me step back and take some time to learn and get to you later on. But so far, continue the path, accelerate it and probably broaden where I think we ought to be focused.

Operator: Our next question comes from Steven Valiquette of Mizuho Securities. Our next question comes from Michael Sarcone of Jefferies.

Michael Anthony Sarcone: Dan, congrats on the new role.

Daniel T. Scavilla: Thanks, Michael.

Michael Anthony Sarcone: Just a follow-up on the tariff stuff and how it relates to margin expansion. You talked about the updated thoughts being about $80 million annualized impact. I don’t want to get too far ahead of ourselves here, but when you think about 2026 and you do see that full impact, how do you think about your ability to continue to expand gross and EBITDA margins?

Daniel T. Scavilla: Yes, Michael, let me start. This is Dan, I’ll hand it over to Matt. But right now, we’re not in a position to project what we want to do in 2026 and the volatility of every hour of every day of the change in tariffs would certainly tell you that prudence says to pause and focus before reacting. And so ultimately, what I think we’re going to do is assess the situation and see, do keep in mind that we have the manufacturing and logistic firepower globally to position ourselves for a benefit longer term, but we’re just simply aren’t going to react in such a volatile market at this point.

Matthew E. Garth: Yes. The only thing I would add to that, Dan, is, as you look at how we’re building the rest of 2025 and the outlook that we gave you, it does embed the tariff impact into our outlook. And the things that are allowing us to manage through that are the good activities that are taking place in the organization. And that’s why having a longer-term view here as to what the value is that we can drive through innovation, through our product pipeline and the changes that Dan spoke about at the top of the prepared remarks, that’s why we’re taking some time to really develop what that’s going to mean for 2026.

Michael Anthony Sarcone: Got it. Okay. That’s helpful. And then second one for me. Dan, in the prepared remarks, you mentioned you’ve already started taking some activities to address the softness in CTS. Any chance you can elaborate on some of those?

Daniel T. Scavilla: I appreciate the question, but I think that let me do it and execute it and tell you what we did versus tell you where we’re going. I’d rather keep that for competitive reasons into this team to go execute.

Operator: Our next question comes from Jonathan Block of Stifel.

Jonathan David Block: Great. Maybe I’ll just start with a clarification. The $50 million that I thought you said going to $80 million tariff annualized headwind, sorry, was that a net number? Or arguably that grows before any mitigating initiatives that maybe you’re able to put in place over the coming months. Just a clarification there.

Matthew E. Garth: That is the gross annualized impact. And again, for 2025, though, based on how we see the components moving, the impact to us in 2025 is still roughly $25 million.

Jonathan David Block: Got it. Not a full year and maybe some inventory that’s at pre-tariff levels on the $25 million. Got it, okay. And then Dan, this one might be too early to ask, but just when we think about some of the company’s prior initiatives, right, there was a lot there. I mean there was ERP, there was SKU rationalization. There were some, call it, consolidating of the manufacturing footprint. You inherit some of those things that are at various stages of completion. So would love your thoughts. I mean, are those top-of-the- list initiatives? Do those all make sense to you? Are those on track according to prior time lines?

Any update that you’re able to give there would be great.

Daniel T. Scavilla: Thanks, Jonathan. Yes, it’s a great question. And so what I’d say is I think all of those are the right moves. I think we have to go deeper and faster for sure. And again, let me go assess some of that and come back at a later date with a bigger, broader plan. But there’s nothing in there that I would step in and say stop this or don’t do this. It made sense. Listen, the real focus and the macro approach here for this company is we need to return the U.S. to health and sustained growth period.

And there’s different mechanisms to do that, but it simply starts with remaining focused and improving our focus on the dentists, the customers and the field, supplying them with great innovation and with a consistent supply chain, and that’s all about supporting it in-house, that’s really where we’re going to stay focused. And if there are some activities to strengthen that, that’s really where we’ll go along those lines. There’ll be some broader things later, but again, more with the focus of the U.S. health first, Rest of World and Europe continuing to feed and then driving through that engine. And that’s really what we’re focusing in with the team now.

Operator: Our next question comes from Jeff Johnson of Baird.

Jeffrey D. Johnson: Dan, I think John just asked you on kind of your commitment to some of those cost savings initiatives and other kind of middle of the P&L kind of efforts that prior management has been focused on. Maybe I’ll go the opposite direction. Just kind of on the top line. There’s been an intense focus over the last couple of years on some of this cloud-based DS Core strategy, some of the equipment becoming cloud-native equipment. My view on that, not that you care about that, I guess, but has always been that might be a great long-term opportunity, harder to monetize that in the short run.

Would love to get your input on kind of how you’re thinking about that commitment to DS Core and the intense focus there versus maybe improving some of the actual hardware and products themselves, especially in some of the specialty areas.

Daniel T. Scavilla: Yes. And Jeff, that’s a fantastic question, seriously. So thanks for asking it. So there’s 2 pathways that you kind of asked, and I’ll go through both. I believe that the world is moving into a proceduralization model, the holistic experience and not just individual components. And so having software and implants and instruments, all that are the best-in-class, are what companies are going to need to go. And of course, there’s data and machine learning and all sorts of things like that, that can create connectivity and better outcomes and better planning. We have to pursue that path. DS Core is obviously a foundation for that.

But as you said, the best software in the world is meaningless unless you have great implants and great instrumentation and a procedural flow that benefits the practitioner. So the answer is, we have to go through all of those, we’ll remain on our course with DS Core. We have to make sure that the investments are healthy and that innovation is consistent in all of those other things of instrumentation and implants as well.

So when Matt and I discuss how to unlock value or where to go, we’re signaling that we need to streamline throughout the entire P&L, not just the middle to free up cash, so that we can reinvest and drive sustained growth through all of those mechanisms.

Jeffrey D. Johnson: Fair enough. And then maybe just one follow-up question. Just on your value implant commentary around MIS and maybe some manufacturing, headwinds there throughout the rest of the year. How confident are you or how are you able to assess whether it’s truly getting product out the door versus market share gains for some of your competitors who have really focused on those value implants as well over the last couple of years. It seems like the value implant side of the market still has a little more strength in premium.

So for that to remain down, and I don’t know, if you said down double digits for the rest of the year, but still down the rest of the year, a little surprised to hear that.

Matthew E. Garth: Yes. No, that’s a good point of reference. The second half of the year will definitely be stronger on the value side. Again, that event in the Middle East that went down, obviously, had an impact on our ability to ship out of the region. And so you’ve seen some headwinds there. But that will flip, and we will be competitive as we move into the second half of the year on the volume side. The bigger piece of the overall implant story though, you’ve also noted, which is overall competitiveness and what is taking shape in the market.

And I think those lean purely into what Dan was talking about with changes and movements and evolutions that are taking place with our sales force in the U.S. We’ve seen over the last couple of weeks, a significant retraining and education program that the U.S. team has launched. Those are the types of efforts that are going to allow us to be able to get back into the game and drive growth in premium.

Operator: Our next question comes from Brandon Vazquez of William Baird.

Brandon Vazquez: I wanted to follow up on a comment, sharing his thought that was going on, I think it was John’s question. But how much of the U.S. business in your mind as you come into the seat is underperforming simply because of execution on behalf of DENTSPLY? Or how much of it is simply underperformance of the dental macro market?

Daniel T. Scavilla: Brandon, it’s a great question. And my honest answer is, let me evaluate it and go deeper and see. To make that split this early on, I’m not really quite comfortable doing it. I do have the belief that we have an incredibly strong team in the field and a great bag. And I think we have to look at ourselves and say, how can we move with better speed and decision-making so that we give our field the chance to actually come out and perform stronger than they’ve been.

What that percent split is versus macro, I don’t really know, but I happen to believe that when you have the right team doing the right things, it softens a lot of those macro impacts anyway. And so let me dig deeper and come back to you once I have some better understanding.

Brandon Vazquez: Okay. And I guess my follow-up is related and it somewhat leads into this, which is the dental market has seen macro headwinds for several years now. I’m not sure, and you guys — I’d be curious, if you guys disagree with me, but I’m not sure we see kind of like a silver lining here and where things are meaningfully improving for dental in the foreseeable future or at least in the next 6 — let’s call it, 2025. Again, if you disagree, please let me know. But in that, if this is the case for a little bit of time now, does DENTSPLY need to readjust to operate in this new environment?

I think the prior leadership team, while there were a lot of great execution initiatives going on, there was a chunk of kind of their EPS goals that was built on improving macro. Is this something that you guys think you will bank on as you start to develop plans? Or do you think the macro is weighing on the sector so much that you need to just build plans to execute regardless and anything that macro would just be upside to that.

Daniel T. Scavilla: I’ll take a swing at that. So I think macro changes over time. And I think that as we look even to your point to the foreseeable future, it will obviously evolve both stronger and weaker over our lifetimes, and that’s something that you need to think about us focused on the long term anyway. How do you thrive in that? I happen to believe that a strong cash flow and a strong profitability that allows you to go buy and execute and do what you want will allow you to react in a very meaningful way and eventually leads the market in a stronger way.

And so U.S. growth right now that generates more profitability through our programs, continuing and expanding that give us stronger profit and cash are going to allow us to not only react to but shape the macro as we go forward. It’s about making sure we focus on the holistic set of our teams and portfolios to be able to do that. And while that sounds lofty, I truly believe that it is more than doable.

Operator: Our next question comes from Allen Lutz of Bank of America.

Allen Charles Lutz: I have a high-level question for Dan and Matt. There’s a lot of areas where you can focus investments as you’ve talked about, sales force, implants, aligners, clinical education, you talked about DS Core. I know it’s very early, so not looking for any specifics on where you’re looking to invest, but just any early learnings and thoughts you’ve had as you’ve looked at the business? And then moving forward, how should we think about timing of potential investments here? And would this be a shift of dollars you’re already spending? Or would this be incremental spend?

Daniel T. Scavilla: Yes, I’ll go first, and then let Matt kind of go in there. So my experience, not just DENTSPLY, but my experience would show that a focus in investing on the customer and the field are always going to be the thing that will help us be the strongest and go. And so that’s going to be there. There’s nothing that Matt and I would signal as a significant shift that would throw off your models at this point, but rather us looking with our eyes where we can find efficiencies and free up cash to reinvest and ideally do that in a way that can generate growth.

So I would tell you, we’re not going to see a radical shift that’s going to throw you off. We are going to dig deep and move fast for sure. But ultimately, I think giving the field what they need, providing the customers what they need is really the key here, and doing that in a faster manner with more options in an easier way is what I think we’re going to focus on.

Matthew E. Garth: Just to add, because I think Dan and I are in 100% alignment. And I — frankly, in my time here so far, I think the entire team is, which is there is a repurposing of spend that we can do to drive speed, to drive growth and put areas where the team was already looking for efficiencies, namely in those middle P&L elements, but certainly within the corporate, shifting those into the field, shifting those into innovation. And so I think that’s the primary viewpoint that I have that I’m going to try and keep them build out with Dan, and the team is of the same mindset.

So I don’t know yet if there’s a significant amount of additional incremental spend. I will tell you we’re going to go through our strategic planning process. We will go through our annual planning process. That will be a great time after that to really hone in on some of the changes that we want to drive from a modeling perspective. But all of it is to reformulate a financial model for DS that returns higher cash, that gives us the optionality for growth and returns to shareholders.

Daniel T. Scavilla: And I would just add one last thing. Matt and I are big fans of spending what we earn and actually reducing leverage that will create longer-term flexibility.

Operator: Our next question comes from Vik Chopra of Wells Fargo.

Vikramjeet Singh Chopra: Dan, congrats on the new role and looking forward to continue to work with you. I just had a quick high-level question, Dan. Maybe just talk about some of the lessons you’ve learned from your time at Globus Medical that you think are applicable here? And then I had a quick follow-up, please.

Daniel T. Scavilla: Vik, thanks. It is great talking to you. Look forward to getting together again. Again, Globus is such a great facility with such great teams. I could talk a lot about that, but I won’t. What I learned from that team is hands-on, literally hands-on, not some executive talking from a tower, but getting in the field with the reps and living their life eye-to-eye with the dentist and then owning it back and making sure there’s execution where you as CEO are accountable to that person in the field to do it and do it better. I think that is the strength of Globus, and that’s what I’m going to bring in here with that learning.

Vikramjeet Singh Chopra: Great. And I had a follow-up question. Apologies if this has been asked. I’ve been bouncing on a couple of calls, but I noted a double- digit decline in implants and prosthetics in the quarter. This is sort of worse than you saw in Q2, which I believe was a mid-single- digit decline. Can you maybe provide some additional color on what you’re seeing in the market and your expectations for the rest of the year?

Matthew E. Garth: Yes. We went over it earlier, but let me do a quick summary here. So we did see a performance trend and the way that we spoke about it was breaking out premium and value in the quarter, premium down slightly. We continue to see the shift from our legacy brands to the new evolutionary products that we made in the market, some changeover headwinds there. On the value side, the volatility in the Middle East did provide a bit of a headwind for us in the quarter. It was significant double digits — low double digits on the value side. That will carry through for the rest of the year.

So on the value side, you will see performance improve, but it will still be down overall for the year. Labs was the other place that we called out that had a significant double-digit decline, primarily in EMEA and the U.S. And so that rounds out, I think, on the implant side. When you look at the aligner side of the house, SureSmile up 3.3% and then you adjust out the Byte performance from the overall segment, that gets you back to that double digits.

Operator: Our next question comes from Steven Valiquette of Mizuho Securities.

Steven James Valiquette: I apologize. Earlier, I was kind of juggling multiple calls at once. Dan, this’s obviously a time for you to focus on in the short term as you’re joining the company. One area that was somewhat in limbo over the past year with some of the relationships with major dental distributors. So I guess, I’m just curious if you could provide a little more color on where that ranks on the totem pole of your priorities. And do you have a general bias coming into the role that distributors are vital or the door be opened maybe somewhere down the road where maybe a larger portion of your sales are direct.

Just curious to getting any early thoughts around this whole topic.

Daniel T. Scavilla: Steven, I appreciate the question. So a couple of things. I did have a chance to connect with both Schein and Patterson CEOs. And we’re going to get together as I get further up to speed, have conversations. I would tell you, I’ll refrain from telling you what I think and where we’re going and what we’re doing right now until I have a chance to better engage and learn this. I am not really focused on the short term. Everything we’re doing is going to be about long term here. That would include what our relationship is with those. So for now, I’m active in speaking and engaging with them. I need to go further.

But let’s kind of readdress that after I’ve got a little bit of time under me.

Operator: Our next question comes from Erin Wright of Morgan Stanley.

Erin Elizabeth Wilson Wright: There have been several iterations of turnaround stories, not just at DENTSPLY, but also across dental. I guess, how — can you talk about what’s different in your approach? And outside of some of these investments that you’re making and execution and everything, what do you really think is like the optimal mix across your business, like to really set yourself up for success in dental and more consistent growth? And are you taking a hard look at even some of the strategies around some of the more flagship areas, for instance, like how do you feel about the game plan around CAD/CAM?

And how much are you taking into account the evolution of the competitive landscape there and other parts of your business that you’re taking a hard look at.

Daniel T. Scavilla: Erin, I appreciate the question, and I think it’s a legitimate question. Being 5 days in, let me dig deep, listen, learn, engage with the field, engage with customers, evaluate this out. Again, I do feel like the company is tracking in the right direction, but not deep and fast enough. I think there are some things we can do better internally. But again, let me get through my listen-and-learn sessions, and I will connect with you and probably give you broader scopes as I get a quarter or 2 under my belt to further answer that question the right way.

Operator: Thank you. This concludes the question-and-answer session. I would like to turn it over to Dan Scavilla, CEO, for closing remarks.

Daniel T. Scavilla: Thank you all for joining the call today. Matt and I look forward to engaging the investment community as we settle into our respective roles. Before we close, I want to take a moment to thank the entire DENTSPLY SIRONA team for the warm welcome and for their unwavering commitment to our customers. As I shared earlier, I’m truly excited to be here and to be part of shaping the future of the organization so that we can accelerate the value we provide to our customers and unlock the true potential of the company. In addition, I want to thank Andrea Daley for her dedication and leadership in the Investor Relations role.

Andrea will be moving into a new opportunity elsewhere. We’re grateful for her contribution, and we wish her continued success in her new role. Thank you, everyone.

Operator: Thank you for your participation in today’s conference. This does conclude the program. You may now disconnect.

Source link

What Is the Highest Alibaba Stock Has Ever Been?

Alibaba’s stock price has suffered even as sales growth continues.

It’s been a tough few years for Alibaba Group (BABA 0.54%) investors. Shares have heavily underperformed the market since 2020. Yet sales have continued to rise. Looking back at the company’s financial history reveals a peculiar picture. It’s not hard to see why some investors think this former growth darling is now a value stock.

Not everything peaked in 2020 for Alibaba

During the COVID-19 pandemic’s height, e-commerce sales spiked, directly benefiting the sales and net income for major retailers like Alibaba. That year, for example, the company generated a staggering $74 billion in sales during its Singles Day event — nearly double the $38 billion brought in the year before.

In the years that followed, however, the company faced antitrust investigations, leading to a $2.8 billion fine. Meanwhile, outspoken founder Jack Ma garnered increased scrutiny from regulators and Chinese party officials.

BABA Chart

BABA data by YCharts.

While growth since 2020 has undoubtedly been tepid, Alibaba’s sales have continued to grow. Its net income is only 26% below its 2020 highs. The stock price, meanwhile, is more than 60% below its pandemic highs. That has brought the company’s price-to-earnings ratio down to just 15.6 — roughly half what the S&P 500 trades at overall.

Server racks in a data center.

Image source: Getty Images.

What’s the future for Alibaba? Sales are expected to grow by 6% this year, with another 8% growth expected the following year. Earnings per share, meanwhile, are expected to hit $62.47 this year, growing to $75.19 next year. Clearly, analysts remain fairly optimistic about the company’s financial situation.

After Alibaba’s stock price peaked in 2020, the company’s growth prospects reset sharply. But with shares trading at just 15.6 times earnings despite expectations for rising sales and earnings, shares seem appealing for contrarian investors looking to add beaten-down stocks to their portfolio.

Ryan Vanzo has no position in any of the stocks mentioned. The Motley Fool recommends Alibaba Group. The Motley Fool has a disclosure policy.

Source link

California Republicans take donations from mogul after sex scandal

When billionaire casino mogul and top Republican donor Steve Wynn was accused of a decades-long pattern of sexual misconduct in the midst of the #MeToo movement, elected officials across the country quickly distanced themselves from him.

The news broke in January 2018, and some Republicans immediately called on their colleagues to return donations from Wynn, who was accused of pressuring employees to perform sex acts.

Sen. Susan Collins told CNN, “I don’t even think it’s a close call to return the money.”

Sen. Lindsey Graham also chimed in: “We should do of ourselves what we ask of the Democratic Party. So I don’t think we should have a double standard for ourselves.”

Within months, Wynn started to donate again, and by 2020, he was once again a major GOP donor, giving millions of dollars to conservative super PACs, President Trump’s reelection campaign, candidates and state Republican parties across the nation.

This year, Wynn gave more than three-quarters of a million dollars to a joint fundraising committee aimed at helping Republicans retake control of the U.S. House of Representatives, and that group gave donations to dozens of incumbents across the country, including nearly every member of California’s Republican delegation to Congress.

The recipients include Reps. Mike Garcia of Santa Clarita and David Valadao of Hanford, whose seats will be hotly contested in next year’s midterm elections because they are key to GOP hopes to retake control of the House.

Elections experts said Wynn’s reemergence in the political arena and the candidates’ willingness to take his money were unsurprising, and unlikely to move voters.

“In politics in general, I think the hope of people who have been accused of wrongdoing is that we’re all amnesiacs. And eight times out of 10 we are,” said Jessica Levinson, an election law professor at Loyola Law School. “Republicans in tight races — very few people are going to vote against them because they got money from a PAC that got money from Steve Wynn.

“At this point, because we’re not in that cycle of breaking news about Steve Wynn, I think it’s probably a pretty reasonable calculation, one, because time has faded and two, because it’s not a direct contribution.”

Wynn donated $771,900 — the maximum allowed — to the Take Back the House 2022 joint fundraising committee on March 26, according to the Federal Election Commission. From that day through the end of the month, the committee, which is controlled by House Minority Leader Kevin McCarthy of Bakersfield, sent $5,800 max-out donations to more than 40 members of Congress, with FEC documentation citing Wynn as the source of the money.

The California Republicans who received these donations are Reps. Devin Nunes of Tulare, Darrell Issa of Bonsall, Doug LaMalfa of Richvale, Tom McClintock of Elk Grove, Michelle Steel of Seal Beach, Valadao, Garcia and McCarthy. Rep. Young Kim of La Habra also received a donation from Take Back the House 2022 on March 31, but her FEC filing does not identify the donor.

McCarthy was the only one to respond to requests for comment.

Asked about the new donations, McCarthy said in a statement, “Steve Wynn is one of the great innovators in the history of modern capitalism. I thank him for his continued support, and I look forward to working with him to retake the House Majority.”

In 2018, McCarthy reportedly gave a Wynn contribution to charity in the aftermath of the sexual misconduct allegations.

Three years ago, a Wall Street Journal investigation found that Wynn had engaged in sexual misconduct for decades. Among the cases cited was one by a casino hotel manicurist who claimed Wynn forced her to have sex with him and who received a $7.5-million settlement, the Journal reported.

Wynn, now 79, responded to the investigation by denying that he had ever assaulted any woman and by blaming his ex-wife for airing the allegations as she sought to revise their divorce settlement.

Though Wynn was never charged criminally, the fallout was severe. He resigned as the head of his namesake company. Gambling regulators in Nevada and Massachusetts fined Wynn Resorts tens of millions of dollars for its executives covering up or ignoring Wynn’s alleged behavior. Wynn agreed to pay Wynn Resorts $20 million to partly settle shareholder lawsuits against the company.

Wynn, who previously had supported Democrats including President Obama, stepped down as finance chair of the Republican National Committee. His name was stripped off a commons at the University of Pennsylvania, his alma mater where he once served as a trustee.

Among the politicians who returned or donated Wynn contributions were Sens. Jeff Flake of Arizona, Rob Portman of Ohio, Dean Heller of Nevada, Tim Scott of South Carolina, and then-House Speaker Paul Ryan of Wisconsin.

McCarthy is in line to take the speaker’s gavel if Republicans win control of the House next year. His Take Back the House 2022 is a joint fundraising committee of 59 members of Congress and 20 other political committees that raised nearly $22 million in the first quarter of this year, according to the Federal Election Commission. Wynn was one of 11 people who maxed out to the committee.

Wynn’s attorney did not respond to a request for comment, but he told the Associated Press that Wynn “has the same rights and entitlements as any other private citizen in the United States of America.”

Four of the Californians who received donations from the PAC — Garcia, Valadao, Steel and Kim — are among the 22 incumbent Republicans targeted by Democrats in the 2022 election. The four seats are in traditional Republican strongholds but their demographics are changing. Mirroring a national trend, these suburban districts have grown increasingly competitive as their residents have grown more diverse. Democrats won the four seats during the blue wave in 2018; Republicans flipped them back last year.

An added uncertainty is redistricting because California lost a congressional seat based on the latest census report. Garcia’s northern Los Angeles County seat, which he won by 333 votes in November, may shift closer to Los Angeles when the redistricting commission redraws the maps, a move that would make it more Democratic.

Source link

Cathay United Bank: Leading Asia’s Green Finance Transition and Building a Sustainable Finance Ecosystem

Focusing on Corporate Sustainability Transition

Seeing the appetite and potential among Taiwan SMEs for green and sustainable finance solutions, CUB has responded with a range of products and strategies that position the bank at the forefront of advancing Asia’s low-carbon future. 

In its home market, CUB focuses on the sustainability needs of SMEs, introducing various initiatives to support decarbonization and business transition. To enhance carbon reduction efficiency, CUB partnered with Taiwan’s first legal entity to obtain carbon inventory verification accreditation—the Metal Industries Research & Development Centre—to provide technical support and accelerate the industry’s transition to net-zero. 

CUB tailors engagement models based on industry type, company size, carbon emissions and ESG maturity, conducting thematic engagement scenarios to address practical decarbonization needs and strengthen clients’ net-zero capabilities. In December 2024, CUB launched Taiwan’s first “SME Sustainable Finance Partner Project,” offering incentives such as cash flow services, foreign exchange deposit benefits, and preferential lending rates to encourage SMEs to adopt greener practices. 

Additionally, CUB pioneered sustainability-linked payroll solutions, motivating corporate employees to participate in green business practices such as energy conservation and carbon reduction, thereby enhancing internal sustainability awareness. 

Exporting Taiwan’s Green Finance Know-how to Support Regional Transformation

In overseas markets, CUB focuses on the sustainability needs of project-based and large enterprises, promoting regional low-carbon transition through green loans, sustainability-linked financing, and social responsibility lending. 

In Singapore, CUB partnered with leading renewable energy company Apeiron Bioenergy at the end of 2023 to launch its first green trade finance facility. The full loan amount was dedicated to supporting the production of sustainable aviation fuel (SAF), demonstrating CUB’s concrete actions in the clean energy sector. 

In Vietnam, CUB structured several green loan initiatives, including green building financing for ICT sector companies, participation in a syndicated loan for VP Bank (with at least 50% of proceeds allocated to green or social projects), and sustainable financing for public water utilities and wind power development—highlighting its impact across diverse industries. 

Further reinforcing its commitment to green corporate finance in the region, CUB hosted the “ESG: Challenges and Practices in Sustainable Development” forum on Earth Day 2025 in Vietnam. The event gathered over 80 industry leaders to explore global and local ESG trends and challenges. The forum showcased CUB’s 20-year presence in Vietnam and its role as a key partner in corporate sustainability transformation. During the event, CUB introduced its “Cathay One” one-stop transition finance platform, designed to help enterprises conduct carbon inventories, formulate decarbonization strategies, and access green financing—enhancing their resilience and competitiveness in the face of climate risks. 

These achievements build on CUB’s milestone in 2022, when it became the first Taiwanese bank to sign a sustainability-linked loan in the Philippines, underscoring its determination and action in promoting green finance across Southeast Asia. 

Leading ESG Disclosure in Asia’s Financial Sector

CUB is the first commercial bank in Asia to participate in CDP’s Corporate Banking Programme, helping corporates systematically assess carbon emissions, climate risk management, decarbonization targets, and governance frameworks to meet growing transparency demands from global investors and supply chains. In 2024, CUB further distinguished itself as the only Asian bank invited to join CDP’s SME Technical Working Group.Through this opportunity, CUB provided insights and advice that helped shaped CDP’s approach to SMEs, including the development of the SME questionnaire. 

After the launch of the SME questionnaire in 2024, CUB invited over 150 companies to participate in the programme. Through the joint efforts of participating enterprises, CDP experts, and CUB colleagues, a total of 121 companies completed the questionnaire and received CDP scores—resulting in a response rate of over 80%, significantly higher than the global supply chain average of around 66%. Notably, 110 of these companies were first-time participants.

Growing regional reach 

“We are committed to building a sustainable financial ecosystem and working with corporate partners to achieve clean energy and climate action goals,” said Michael Wen, Executive Vice President from CUB. CUB will continue to leverage its financial capabilities and regional influence to drive sustainable development across Asia. 

Source link

Gold surges to record high as central banks turn from dollar to bullion

Published on
02/09/2025 – 13:52 GMT+2


ADVERTISEMENT

Gold jumped to a record $3,508.50 (€3,015.08) an ounce on Tuesday, fuelled by expectations of a US Federal Reserve rate cut and mounting uncertainty for investors.

The precious metal is seen as a haven for investors, with demand for it surging when trust in the stability of paper currencies or financial markets dips.

Earlier this year, gold prices surged when US President Donald Trump announced a raft of controversial tariffs against other countries.

Gold’s record-high value underscores deep unease over the global outlook and questions about the Fed’s independence as US President Donald Trump ramps up pressure on policymakers.

Dollar is no longer the ‘gold standard’

The rise in gold prices has come as part of a multiyear rally for precious metals.

Central banks from Asia to the Middle East have been accelerating their purchases for the fourth year in a row, adding a powerful tailwind to prices, with predictions being that at least 1,000 metric tonnes of gold will be purchased by governments for their gold reserves.

The move reveals a decreasing reliance on the US dollar at a time when Washington’s fiscal trajectory and political battles are clouding its standing as the world’s reserve currency.

A survey of 73 central banks conducted by the World Gold Council revealed that 95% of them are expected to increase their gold holdings over the next 12 months, while nearly three-quarters of them are anticipated to shrink their dollar reserves.

China, who is still locked in negotiations with the US over a more favourable trade deal, has been accumulating gold on a monthly basis, recording its ninth straight month of purchases in July.

De-dollarisation will hurt the world’s most reliable currency

For much of modern history, most national currencies were tied directly to gold — namely, governments guaranteed that paper money could be exchanged for a fixed weight of gold they had stored in their reserves.

Everyday transactions were carried out with paper money because it was far simpler than calculating gold values or carrying bullion, while governments backed those notes with gold held securely in their vaults.

After World War II, dozens of Allied nations gathered in Bretton Woods in New Hampshire to host the United Nations Monetary and Financial Conference.

They decided to create the International Monetary Fund and the World Bank, and established a system where the US dollar was pegged to gold at $35 an ounce.

In other words, one dollar represented 1/35th of an ounce. At the time, this peg gave the dollar unmatched credibility because the US then held most of the world’s gold reserves.

It provided stability for global trade and investment for about 27 years, until the US abandoned the gold peg in 1971, collapsing the Bretton Woods system.

Ghosts of Bretton Woods

Bretton Woods collapsed in 1971 when the US deficit and inflation drained gold reserves, making the $35 peg unsustainable.

President Richard Nixon ended dollar convertibility at the time, forcing currencies to float freely.

Once currencies began floating after Bretton Woods, foreign exchange or Forex markets became the arena where their values were set.

Instead of governments guaranteeing fixed rates, traders, banks and central banks now buy and sell currencies against one another, with prices at times shifting by the second.

Now, US policies are once again influencing the gold-buying habits of central banks, and it is particularly symbolic that gold has surged past $3,500 an ounce — an increase of more than 10,000% from the $35 peg set under Bretton Woods after World War II.

Source link