Uber shares have more than tripled in the past three years.
Uber Technologies(UBER 1.05%) is a monster success story in the mobile age. The company, which was founded in 2009, has become a dominant platform that has a presence in more than 70 countries across the globe. Uber is so highly regarded that the company name is used interchangeably as a verb, a standing not many businesses achieve.
This transportation-as-a-service stock has been a huge winner. Just in the past three years, shares have rocketed 213% higher (as of Sept. 5). Besides this momentum, here’s one reason every investor should know about Uber.
Image source: Getty Images.
Uber’s most impressive trait
Uber benefits from a powerful network effect. This favorable setup supports its competitive position. Its mobility segment connects riders with drivers. As the number of riders increases, drivers find the platform much more valuable, as they can generate more income from a bigger customer base.
On the other hand, more riders will come on board as well because the experience will improve with greater driver supply. Riders might see better pricing and lower wait times.
The same situation applies to the delivery segment. Only this time, a larger number of restaurants is introduced on the supply side.
Only getting better
There are key indicators that reveal the strength of the network effect. For instance, Uber’s user base continues to grow at an impressive pace. The company had 180 million monthly active platform consumers (MAPCs) (as of June 30), up 15% year over year. What’s more, the average number of trips per MAPC was 18.2 in Q2, up from 17.7 in the same period of 2024, showcasing impressive levels of engagement.
In recent years, Uber’s revenue and operating income have soared. The business is finding remarkable success, which has supported the stock’s rise. Credit goes to the network effect, a competitive advantage that investors should understand about Uber.
Neil Patel has no position in any of the stocks mentioned. The Motley Fool has positions in and recommends Uber Technologies. The Motley Fool has a disclosure policy.
Keeping your money in a Wells Fargo savings account could cost you $5,000 over the next decade.
The reason is simple: Wells Fargo pays just 0.01% APY, while top high-yield savings accounts are offering around 4.00%. That’s the difference between pennies in interest and thousands of dollars in growth.
If you’re still stashing cash with a traditional bank, it might be time to make the switch.
The hidden cost of low savings rates
Here’s a quick look at how much more you could earn by moving your money from a basic Wells Fargo savings account (0.01% APY) to a high-yield savings account paying 4.00% APY:
Balance
Wells Fargo (0.01% APY)
HYSA (4.00% APY)
$5,000
$0.50/year
$200/year
$10,000
$1/year
$400/year
$25,000
$2.50/year
$1,000/year
Data source: Author’s calculations.
Sadly, I’m a victim of missed interest myself. For years, I had over $20,000 sitting in a Chase checking account earning a pathetic 0.01% APY. At the time, I was stacking up cash for rental property down payments, thinking it was smart to keep it “safe” and liquid.
But one day I wisened up and compared rates at other banks. And whoa!… I realized keeping my cash with Chase all those years was a huge mistake. Honestly, I’ve likely missed out on over $5,000 in interest over the years — I feel sick just thinking about it.
Oh well, onwards and upwards… I’ve been making up for it ever since. My new bank has paid me over $2,000 in interest since switching, and I’m earning a 4.00% APY right now.
Online banks are just as safe
A big misconception about using online banks is that it’s risky or a hassle to access your cash. But that’s not really the case at all.
If anything, online banks are more easy and convenient to work with. And they’re super safe.
Most online high-yield savings accounts today are:
FDIC-insured up to $250,000 — just like Wells Fargo, Chase, BofA, or other big bank accounts.
Have no monthly fees or account minimums for most accounts.
Fully digital — You can open an account and manage everything from your phone.
Linked directly to your checking account for easy transfers.
I know it’s nerve wracking moving a chunk of your hard-earned savings to a new bank. But you’ll quickly realize that online banks are just as safe and secure as traditional, old-school banks.
I recently helped a friend open an HYSA, and it took us less than 10 minutes. Her money took one day to transfer from Wells Fargo to the new bank. And as soon as it landed in her new account she began earning daily interest.
Here’s a quick overview of the process:
Open a high-yield savings account online (it takes about five minutes).
Link it to your Wells Fargo checking account. Most apps allow you to “connect” your accounts at other banks for faster money transfers.
Transfer your savings and start earning real interest immediately.
That’s it. You’ll still have access to your money, but now it’ll actually be working for you.
You don’t even need to close your old Wells Fargo account. Keep it for everyday banking if you like (as long as you aren’t paying those pesky monthly fees).
These days, I make about $60 to $70 in interest every month depending on my balance.
This is real money, that I buy real stuff with.
You can earn bigger interest too. You just need to open an account and move some money over.
This AI player has delivered earnings and share price performance over time.
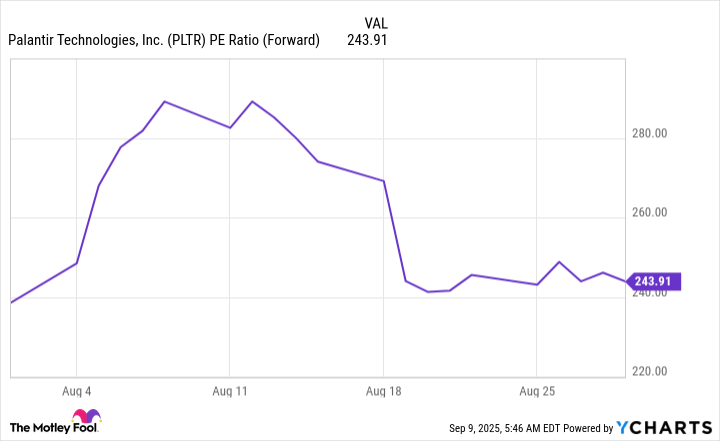
Some investors and analysts alike have expressed mixed feelings about Palantir Technologies(PLTR 4.00%) over the past couple of years. Yes, demand for the company’s software has been booming and translating into fantastic earnings growth. But this also has resulted in a soaring valuation as other investors piled into the stock. Palantir has traded for as much as 289 times forward earnings estimates in recent times, a level that many consider exorbitant.
But in recent weeks, Palantir stock has pulled back, dropping as much as 18% since early August. And this movement has pushed the stock price to a few dollars away from Wall Street’s average 12-month price forecast. Is it finally time to buy this high-growth player? Let’s find out.
Image source: Getty Images.
Why has Palantir soared?
So, first, let’s consider why Palantir, up a mind-blowing 1,900% over the past three years, has climbed so much in the first place. It’s important to note that, though Palantir has existed for more than 20 years, the company only launched an initial public offering five years ago. The company took its time refining its products and strategy and working to move closer to profitability before deciding on such an operation.
And though Palantir stock advanced in the months following its IPO, the stock truly started to pick up major momentum about two years ago. This coincides with the launch of the company’s Artificial Intelligence Platform (AIP), software that, integrating the power of AI, helps customers bring together all of their disparate data and use it to supercharge decision-making and growth.
Palantir, in the past, was most associated with government contracts, but the launch of AIP boosted the commercial business — and now both government and commercial revenues are soaring in the double digits quarter after quarter. Uses for AIP are vast, from the military applying it to real-time decision making on the battlefield to commercial customer United Airlines using it to predict maintenance issues.
All of this has helped Palantir reach profitability and grow the commercial business from a handful of customers just four years ago to 485 today.
This may be the beginning…
Chief executive Alex Karp in recent quarters has said growth is in its early stages, and in the latest letter to shareholders wrote, “This is still only the beginning of something much larger.” Considering the AI market is set to grow from billions of dollars today to trillions of dollars in just a few years, according to analysts’ forecasts, this may be very true.
Palantir’s AIP offers customers an opportunity to quickly and easily apply AI to their operations, and this sort of service already is showing itself to be in high demand — as need for AI grows, this could continue.
As mentioned above, the one problem that Palantir has faced over the past year or so is valuation. As some investors looked at the company’s booming sales and stellar ability to balance growth with profitability, they rushed to get in on this AI player. And that pushed many Wall Street analysts to warn investors about buying the stock at current valuations.
Now, though, following recent declines, the stock has been trading for less than $160. The average Wall Street share price target is about $151. Since Palantir has neared this average estimate, some investors may view the stock as more reasonably priced than it was in the past. The stock traded for more than $181 at its high in August.
And this also has lowered valuation, with the stock now trading at 243x forward earnings estimates, down from 289x just a month ago.
Does this mean that now, on the dip, is a good time to buy Palantir? It’s important to note that, if you’re a value investor, you’ll still find Palantir expensive at today’s valuation. But it’s also important to say that it’s hard to apply such valuation measures to high growth tech stocks — since these measures reflect earnings estimates in the near term but don’t include the potential a few years down the road.
Meanwhile, demand for Palantir’s software is going strong and future prospects look bright so there’s reason to be confident about the company’s future. And Palantir’s recent drop, bringing it near Wall Street’s average 12-month price forecast, shows the stock may be approaching a level that could appeal to investors — especially those who thought the price was too high in the past.
All of this means, if you’re a growth investor looking for a potential long-term AI winner, it’s a great idea to buy Palantir now on the dip.
Shopify and Uber Technologies could match Palantir’s current market value within five years.
Palantir Technologies shares have advanced 1,760% since the launch of its artificial intelligence platform in April 2023. Its market capitalization now stands at $369 billion as of September 8, which puts it among the 30 largest public companies in the world.
I think Shopify(SHOP -1.86%) and Uber Technologies(UBER 1.05%) can surpass Palantir’s current market capitalization within five years. Here’s what that means for shareholders:
Shopify is worth $189 billion. Its market value must increase 96% to hit $370 billion, in which case the stock would return more than 14% annually over the next five years.
Uber is worth $197 billion. Its market value must increase 88% to hit $370 billion, in which case the stock would return more than 13% annually over the next five years.
Importantly, the S&P 500(^GSPC 0.27%) has historically advanced roughly 10% per year, so my predictions almost certainly imply market-beating returns for Shopify and Uber shareholders. Here’s why I’m confident.
Image source: Getty Images.
1. Shopify
Shopify reported excellent financial results in the second quarter, beating estimates on the top and bottom lines. Revenue increased 31% to $2.6 billion as growth accelerated across North American, Europe, and Asia-Pacific. Non-GAAP net income increased 35% to $0.35 per diluted share.
The investment thesis for Shopify centers on its leadership in e-commerce software. Its platform helps merchants manage their businesses across physical and digital storefronts from a single dashboard. The company also provides adjacent solutions for payments, advertising, logistics, and cross-border commerce.
Shopify is focused on several strategic growth areas, including business-to-business (B2B) commerce, a category that is three times bigger than business-to-consumer (B2C) commerce and growing just as quickly. Forrester Research last year recognized Shopify as a leader in B2B commerce solutions, validating its push into the market. The company said B2B sales increased 101% in the second quarter.
Shopify is leaning into demand for artificial intelligence (AI). Shopify Magic is a suite of AI features that help merchants automate tasks like writing product descriptions, generating marketing content, and providing customer support. Additionally, the company earlier this year introduced an AI tool that builds entire online storefronts from a few keywords.
Wall Street expects Shopify’s earnings to increase at 34% annually during the next three to five years. That makes the current valuation of 81 times earnings look somewhat expensive. But if Shopify meets the consensus estimate, its price-to-earnings multiple could fall to 38 while its market value increased 100% to $378 billion by mid-2030. That means Shopify can surpass Palantir’s current market value within five years.
2. Uber Technologies
Uber reported encouraging financial results in the second quarter. beating the consensus estimate on the top line and matching the consensus estimate on the bottom line. Revenue increased 18% to $12.7 billion, an acceleration from 14% growth in the previous quarter, because of strength in the mobility and delivery segments. GAAP net income increased 34% to $0.63 per diluted share.
Uber may not be top of mind when investors think about artificial intelligence stocks, but the company uses AI to set prices, match drivers and riders, and optimize routes. Moreover, its position as the largest on-demand mobility and delivery platform in the world makes it an ideal partner for autonomous driving companies that want to commercialize robotaxi services.
Uber has partnered with 20 autonomous driving companies, including Alphabet‘s Waymo, Pony AI, and WeRide. Robotaxis are already available on its platform in four markets: Atlanta, Austin, and Phoenix in the United States; and Abu Dhabi in the United Arab Emirates. Uber expects about five more deployments in 2025, with more to follow in 2026.
Additionally, Uber in some cases is helping partner companies develop autonomous driving technology. “An underappreciated aspect of our strategy is just how central we are to the real-world AI revolution,” said CEO Dara Khosrowshahi in prepared remarks. “The advanced AI systems that perceive, predict, and make split-second decisions on the road need enormous amounts of data, and Uber has the most relevant mobility ride-hail dataset in the world.”
Wall Street expects Uber’s earnings to increase at 22% annually over the next three to five years. That makes the current valuation of 16 times earnings look relatively cheap. And if Uber meets that consensus, its price-to-earnings ratio could fall to 12 while its market value increased 105% to $387 billion by mid-2030. That means Uber can surpass Palantir’s current market value within five years.
Trevor Jennewine has positions in Palantir Technologies and Shopify. The Motley Fool has positions in and recommends Alphabet, Palantir Technologies, Shopify, and Uber Technologies. The Motley Fool has a disclosure policy.
This artificial intelligence (AI) specialist leveraged decades of expertise in information technology (IT) and cloud systems and is on a path to earn membership in a very exclusive fraternity.
There’s no denying the trajectory of artificial intelligence (AI) over the past few years. Many of the companies that have pivoted to adopt this game-changing technology have ascended the ranks of the world’s largest companies when measured by market cap. When the stock market closed on Tuesday, there were 11 members of the vaunted $1 trillion club, the vast majority of which have significant ties to AI.
After the market close, industry stalwart Oracle(ORCL 1.37%) reported its recent quarterly results, and despite missing Wall Street’s expectations, the stock surged higher and never looked back. Why? In a stunning turn of events, the company signed numerous multibillion-dollar contracts that kicked its future growth potential into overdrive.
Given the magnitude of these deals, it seems the writing is on the wall for Oracle to join this elite fraternity. The company’s growth is at a tipping point, and management’s commentary suggests the company has a long AI-centric runway for growth ahead.
Image source: Getty Images.
A trusted partner
Oracle holds a coveted place in the technology community, as roughly 98% of Global Fortune 500 companies make up its customer rolls. The industry stalwart provides its customers with a strategic combination of cloud, database, and enterprise software. Naturally, when the shift to AI began in earnest, this captive audience began to turn to Oracle for its expanding collection of cloud and AI solutions.
The company’s growth has been uneven, but the future looks bright. During Oracle’s fiscal 2026 first quarter (ended Aug. 31), total revenue grew 11% year over year to $14.9 billion, while its adjusted earnings per share (EPS) of $1.47 grew by 6%. Both numbers accelerated compared to Q4, but missed Wall Street’s consensus estimates, which called for revenue of $15 billion and adjusted EPS of $1.48.
However, that wasn’t the headline. Last quarter, CEO Safra Catz noted that the company had reached a “tipping point,” noting that revenue growth was accelerating, “and it’s only going up from here.”
That turned out to be an understatement. Oracle reported explosive growth in its remaining performance obligation (RPO) — or contractual obligations not yet included in revenue — which skyrocketed 359% year over year to $455 billion, up from $138 billion in Q4.
Catz explained, “We signed four multibillion-dollar contracts with three different customers in Q1,” calling the results “astonishing.” He went on to say that demand for Oracle Cloud “continues to build.” The company expects to sign “several additional multi-billion-dollar customers and RPO is likely to exceed half a trillion dollars.”
Looking to the future, Oracle is forecasting Oracle Cloud Infrastructure revenue to grow 77% to $18 billion this year — but that’s just the beginning:
Fiscal 2027 cloud revenue of $32 billion, up 78%.
Fiscal 2028 cloud revenue of $73 billion, up 128%.
Fiscal 2029 cloud revenue of $144 billion, up 97%.
Mind you, this is just Oracle Cloud Infrastructure revenue, and Catz noted that “most of the revenue in this five-year forecast is already booked in our reported RPO.” That means that any future contracts will probably increase those growth targets.
The path to $1 trillion just got much shorter
Oracle is leveraging its position as a trusted partner to help customers choose suitable AI and cloud solutions and profit from the growing adoption of generative AI.
Before today’s results, Wall Street was expecting Oracle to generate revenue of $66.75 billion in its fiscal 2026 (which began June 1), giving it a forward price-to-sales (P/S) ratio of about 10. Assuming its P/S remained constant, Oracle needed to generate revenue of approximately $98 billion annually to support a $1 trillion market cap. Given those figures, Oracle could have achieved a $1 trillion market cap before 2028.
Wall Street hasn’t yet had time to update its models, but given the magnitude of the company’s results, previous forecasts are out the window. Barring unforeseen circumstances, I predict Oracle will join the $1 trillion club within the next 12 months.
Estimates regarding the market potential of generative AI continue to ratchet higher. Big Four accounting firm Price Waterhouse Coopers (PwC) calculates the opportunity could be worth as much as $15.7 trillion annually by 2030, which illustrates the magnitude of the opportunity.
Given the recent contract wins, Oracle has proven that it is leveraging its experience to profit from this windfall. The writing is on the wall, and Oracle is poised to join the fraternity of trillionaires in short order.
Danny Vena has no position in any of the stocks mentioned. The Motley Fool has positions in and recommends Oracle. The Motley Fool has a disclosure policy.
A whole bunch of investors seem to think so… maybe too many.
SoFi Technologies(SOFI 0.02%) is attracting lots of investor attention these days, and understandably so. Its stock up more than 160% from its April low, and higher to the tune of 260% for the past year. That’s huge.
But is it actually the buy the crowd seems to think it is? Yes. And no.
Here’s some food for thought if this ticker’s made its way onto your radar but not yet made its way into your portfolio.
What’s SoFi Technologies?
SoFi is an online bank, except it’s only an online bank; it doesn’t operate any brick-and-mortar branches. That doesn’t mean it can’t offer everything a traditional bank does, though. Checking and savings accounts, investment services, loans, insurance, and credit cards are all in its repertoire.
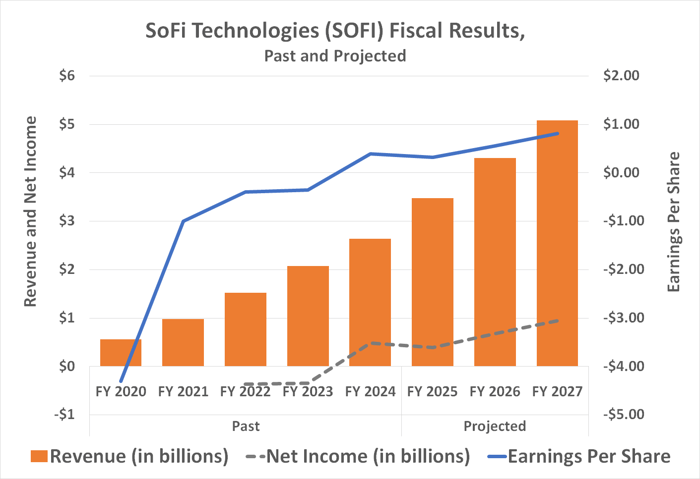
It’s no mere experiment either. The $30 billion company serves more than 11.7 million customers and boasts $36.3 billion in assets. And of last quarter’s revenue of $855 million (a fairly typical quarter), nearly $98 million of that was turned into net income.
Image source: Getty Images.
Of all these numbers, however, the most impressive is SoFi’s current customer headcount.
While its 11.7 million members pales in comparison to the customer bases of Wells Fargo and Bank of America, it’s incredible for a bank that’s only been chartered since January of 2022. Making this customer count figure even more impressive is the fact that it’s grown every single quarter since the first quarter of 2020, when it was still more of a fintech middleman with a limited number of offerings. In fact, on an absolute basis SoFi’s customer growth is still accelerating rather than slowing down, with last quarter’s year-over-year member growth of 34% carrying its customer count to yet another record-breaking figure of 11.7 million.
The new norm
The company is of course plugged into the massive shift in the way most consumers live their lives. That’s online, and in particular, through their favorite connected device — their smartphone.
A survey commissioned by the American Bankers Association late last year tells the tale. Of the 4,508 adults questioned, only 8% said in-branch visits were their preferred way of handling banking business, while only 4% named telephone calls as their top means of taking care of any banking matters. At the other end of the scale, 22% of respondents reported they were managing their bank accounts using a laptop or PC, while a whopping 55% of these consumers said a mobile app was their favorite banking tool. And it should come as no real surprise that younger people were far more likely than older customers to utilize their digital options.
SoFi’s growth simply reflects this new norm, which of course corresponds with the ongoing aging of digitally native consumers.
More of the same is in the cards too. Market research outfit Technavio believes the worldwide digital banking business is set to grow at an average annualized pace of more than 16% through 2029. The U.S. market that SoFi Technologies serves is expected to see the most growth during this stretch. For its part, analysts believe SoFi’s top and bottom lines will nearly double between last year and 2027.
Data source: StockAnalysis.com, SimplyWallSt.com, Marketwatch. Chart by author.
The kicker: At least some of this future growth will be driven by the company’s foray into business lines beyond basic banking. In July, for instance, the bank offered access to an expanded lineup of private investments, and earlier this month launched another of its own sponsored exchange-traded funds — the SoFi Agentic AI ETF(AGIQ 0.26%). This willingness to establish new profit centers underscores the idea that the company is casting an ever-widening net.
Right stock, wrong time
So it’s a buy? Not so fast.
There’s never a bad time to buy a good stock, to be clear. But there are certainly better times than others. Right now arguably isn’t the best time to buy this one.
The issue is the sheer scope of SoFi stock’s run-up just since the middle of last year. While its bullishness is understandable, it’s also too much, too fast. Shares have more than doubled in value in just a little over a year, pushing them to a recently reached record that’s more than 20% above the analyst community’s current consensus price target of $20.72.
The stock’s valuation of nearly 50 times next year’s expected per-share earnings of $0.52 is also steep for any stock, but it’s particularly rich for a bank — even one growing as quickly as SoFi Technologies. So interested investors might want to wait for a pullback before plowing in. The good news is, we’ve frequently seen lulls from this ticker before.
Just don’t get too picky if you want to buy in. It’s unlikely you’ll see what you might consider a great price for this stock anytime soon; any modest lull may be all you’re going to get. The growth here is just too strong and the company’s story is too compelling to expect any major pullback from the stock.
Wells Fargo is an advertising partner of Motley Fool Money. Bank of America is an advertising partner of Motley Fool Money. James Brumley has no position in any of the stocks mentioned. The Motley Fool has no position in any of the stocks mentioned. The Motley Fool has a disclosure policy.
(Bloomberg) — Chipotle Mexican Grill Inc. and Khosla Ventures LLC are among investors providing a fresh round of funding for a startup that makes fertilizer from ground almond shells. Read More
WASHINGTON — Chief Justice John Roberts on Tuesday temporarily kept in place the Trump administration’s decision to freeze nearly $5 billion in foreign aid.
Roberts acted on the administration’s emergency appeal to the Supreme Court in a case involving billions of dollars in congressionally approved aid. President Trump said last month that he would not spend the money, invoking disputed authority that was last used by a president roughly 50 years ago.
The high court order is temporary, though it suggests the justices will reverse a lower court ruling that withholding the funding was probably illegal. U.S. District Judge Amir Ali ruled last week that Congress would have to approve the decision to withhold the funding.
Trump told House Speaker Mike Johnson (R-La.) in a letter Aug. 28 that he would not spend $4.9 billion in congressionally approved foreign aid, effectively cutting the budget without going through the legislative branch.
He used what’s known as a pocket rescission. That’s when a president submits a request to Congress toward the end of a current budget year to not spend the approved money. The late notice means Congress cannot act on the request in the required 45-day window and the money goes unspent.
The Trump administration has made deep reductions to foreign aid one of its hallmark policies, despite the relatively meager savings relative to the deficit and the possible damage to America’s reputation abroad as foreign populations lose access to food supplies and development programs. The administration turned to the high court after a panel of federal appellate judges declined to block Ali’s ruling.
Justice Department lawyers told a federal judge last month that an additional $6.5 billion in aid that had been subject to the freeze would be spent before the end of the fiscal year Sept. 30.
The case has been winding its way through the courts for months, and Ali said he understood that his ruling would not be the last word on the matter.
“This case raises questions of immense legal and practical importance, including whether there is any avenue to test the executive branch’s decision not to spend congressionally appropriated funds,” he wrote.
In August, the U.S. Court of Appeals for the District of Columbia Circuit threw out an earlier injunction Ali had issued to require that the money be spent. But the three-judge panel did not shut down the lawsuit.
After Trump issued his rescission notice, the plaintiffs returned to Ali’s court and the judge issued the order that’s now being challenged.
President Herbert Hoover had the worst average annual GDP growth rate so far at -9.3%. That’s because in October 1929, during Hoover’s first year of his term, the stock market crashed and led to the Great Depression, the most severe and longest economic recession in modern world history.
Hoover took a laissez-faire (low government intervention) approach in response to the Great Depression and vetoed several bills that would have provided relief to Americans impacted by the recession. He also signed the Smoot-Hawley Tariff Act into law, which raised the costs of important goods and affected trade. The GDP growth rate fell to -12.9% in 1932, while unemployment soared to 25% in 1933.
Franklin D. Roosevelt (1933–1945)
Average Annual GDP Growth Rate: 10.1%
President Franklin D. Roosevelt had an average annual GDP growth rate of 10.1% during his four-term presidency, the highest growth rate of any president so far. FDR introduced a series of government programs known as the New Deal to help stimulate the economy during the Great Depression. The New Deal aimed to maintain infrastructure, create jobs, and boost businesses across the country. The New Deal also included programs such as Social Security.
While the New Deal did help the economy recover and helped reduce income inequality in the United States, some economists question its true impact on the economy and even say it may have prolonged the recession by several years. Critiques of the New Deal say that too much government aid may have hindered the economy’s natural way of rebounding after a deep recession. Still, economists consider 1941 as the end of the Great Depression because GDP increased and unemployment dropped. This was also the year when the U.S. entered WWII.
FDR’s social programs also came with major tax increases and national debt. Roosevelt contributed the largest percentage increase to the U.S. national debt between his New Deal initiatives and, more significantly, spending on World War II.
Harry S. Truman (1945–1953)
Average Annual GDP Growth Rate: 1.4%
President Harry Truman had an average annual GDP growth rate of 1.4%. The economy went through two mild recessions during Truman’s term: one in 1945 due to a drop in government spending after the end of WWII and another from 1948 to 1949 as the economy corrected in the wake of a postwar spending boom.
Truman had the difficult job of transitioning the economy from wartime to peacetime without sending it into a recession, and, in large part, did manage to maintain a healthy peacetime economy. Truman also wanted to extend some of the New Deal’s economic programs, such as a higher minimum wage and housing. Still, only a few of his proposals became law due to facing opposition in CongressTruman’s’s Marshall Plan sent $12 billion to help rebuild Western Europe after WWII, boosting the U.S. economy by creating a demand for American goods. The Korean War began durinTruman’s’s term in 1950, leading to $30 billion in government spending that helped boost economic growth under Truman.
Dwight Eisenhower (1953–1961)
Average Annual GDP Growth Rate: 2.8%
President Dwight D. Eisenhower had an annual GDP growth rate of 2.8%. During his time in office, the economy experienced three recessions, and the Korean War ended in 1953. Eisenhower helped boost economic growth with the Federal-Aid Highway Act of 1956, which aimed to rebuild the country’s interstate highways. The government spent a total of $119 billion on the project.
The economy contracted into a recession again from 1957 to 1958 when the Federal Reserve raised interest rates. However, Eisenhower refused to use fiscal policy to stimulate the economy, instead opting to maintain a balanced budget.
John F. Kennedy (1961–1963)
Average Annual GDP Growth Rate: 5.2%
President John F. Kennedy had an average annual GDP growth rate of 5.2%. Kennedy and his administration helped end the 1960 recession (the fourth major recession since WWII) by increasing domestic and military spending. Kennedy also raised the minimum wage and increased Social Security benefits.
Lyndon B. Johnson (1963–1969)
Average Annual GDP Growth Rate: 5.2%
President Lyndon B. Johnson had an average annual GDP growth rate of 5.2%. LBJ was sworn in two hours after Kennedy’s assassination and was re-elected in 1964 after getting 61% of the vote.
Johnson increased government spending and pushed through tax cuts and the civil rights bill proposed during Kennedy’s term. Johnson’s Great Society program in 1965 created social programs such as Medicare, Medicaid, and public housing. While the economy grew under LBJ with strong businesses and low unemployment, prices began to rise rapidly, and inflation ticked up. However, Johnson did not raise taxes to curb spending and cool inflation. Johnson also escalated the Vietnam War, which began during his term, but he was unable to end it.
Richard Nixon (1969–1974)
Average Annual GDP Growth Rate: 2.7%
President Richard Nixon had an average annual GDP growth rate of 2.7%. Though Nixon attempted to cool the inflation that began during LBJ’s term without causing a recession, his economic policies caused a period of stagflation that lasted for a decade. This period was a result of double-digit inflation and economic contraction.
Nixon imposed tariffs and wage-price controls, which led to layoffs and slower growth. The value of the dollar also fell during Nixon’s term when he ended the gold standard. The aftermath of Nixon’s economic policies is called the Nixon Shock.
Gerald R. Ford (1974–1977)
Average Annual GDP Growth Rate: 5.4%
President Gerald R. Ford had an average annual GDP growth rate of 5.4%. The economy had contracted and was in a recession from 1974 to 1975 due to stagflation from Nixon’s time. Ford and his administration cut taxes and reduced regulation to stabilize the economy, and ended the recession. However, inflation remained high.
Jimmy Carter (1977–1981)
Average Annual GDP Growth Rate: 2.8%
President Jimmy Carter had an average annual GDP growth rate of 2.8%. Stagflation continued into Carter’s term, and was made worse by an energy crisis that led to soaring gas prices and shortages. Carter deregulated oil prices to stimulate domestic production and also deregulated the airline and trucking industries. The Iranian hostage crisis in 1979, however, led to economic contraction. Carter also had the highest inflation rate among U.S. presidents to date.
Ronald Reagan (1981–1989)
Average Annual GDP Growth Rate: 3.6%
President Ronald Reagan had an average annual GDP growth rate of 3.6%. The economy went into a recession in 1981 after the Fed raised interest rates to 20% in an effort to cool inflation.
Reagan’s economic policies, later known as Reaganomics, aimed to end the recession through decreased government spending, tax cuts, increased military spending, and reduced social spending. While these policies helped bring inflation down, Reagan added over $1.86 trillion to the national debt and made the budget deficit worse. Critics of Reagan’s economic policies also say he widened the nation’s wealth gap, and that his deregulation of the financial services industry may have contributed to the Savings and Loan Crisis in 1989.
George H.W. Bush (1989–1993)
Average Annual GDP Growth Rate: 1.8%
President George H.W. Bush had an average annual GDP growth rate of 1.8%. Bush’s administration had to contend with the fallout of the Savings and Loan Crisis, which unfolded during the 1980s and 1990s and contributed to a recession in 1990–1991. In 1989, Bush agreed to a $100 billion government bailout plan to help banks out of the Savings and Loan Crisis. Bush also raised taxes and cut government spending in an effort to reduce the budget deficit.
Bill Clinton (1993–2001)
Average Annual GDP Growth Rate: 4.0%
President Bill Clinton had an average annual GDP growth rate of 4%. The economy grew for 116 consecutive months, with 22.5 million jobs created in Clinton’s two terms. Clinton signed the North American Free Trade Agreement (NAFTA) which increased growth by getting rid of tariffs between the U.S., Canada, and Mexico. Clinton also lowered the national debt, creating a budget surplus of $70 billion. Clinton raised taxes on the wealthy and briefly cut government spending to reform welfare.
George W. Bush (2001–2009)
Average Annual GDP Growth Rate: 2.4%
President George W. Bush had an average annual GDP growth rate of 2.4%. Bush’s two terms came with major events such as the 9/11 attacks (2001), Hurricane Katrina (2005), and the 2008 recession. Bush launched the War on Terror by creating and expanding the U.S. Department of Homeland Security (DHS) in response to the 9/11 attacks. Bush also faced the Great Recession in 2008, which was considered the most severe recession since the Great Depression. Bush’s military spending and significant tax cuts in response to the recession added about $4 trillion to the national debt.
Barack Obama (2009–2017)
Average Annual GDP Growth Rate: 2.3%
President Barack Obama had an average annual GDP growth rate of 2.3%. Obama ended the 2008 recession he inherited with the American Recovery and Reinvestment Act (ARRA), an $831 billion stimulus package passed by Congress aimed at cutting taxes, extending unemployment benefits, and improving infrastructure and education. However, Obama is the president who added the most to the national debt, in dollar amounts, with his recession relief measures.
Still, Obama bailed out the auto industry in the U.S. and created 11.3 million new jobs during his two terms. Inflation and interest rates also remained low. He also ended the Iraq War and reduced troops in Afghanistan. Obama’s economic policies, now known as Obamanomics, were controversial at the time, and his role in ending the 2008 recession is still debated.
Important
Note that the following section only highlight’s Trump’s first term in office.
Donald Trump (2017–2020)
Average Annual GDP Growth Rate: 2.3%
President Donald Trump had an average annual GDP growth rate of 2.3%. While there were no major wars or recessions during Trump’s presidency, he did face the COVID-19 pandemic in 2020, his last year in office. Trump increased spending and cut taxes, while the Fed raised interest rates in response to Trump’s expansionary fiscal policies.
Trump placed import taxes on products from China, particularly steel and aluminum, to boost sales of American-made products. However, it hurt the sales of American exports instead, as China responded by placing tariffs on products it imported from the U.S. It also increased costs for American consumers.
The economy went into recession with the onset of the COVID-19 public health crisis in March 2020 as businesses closed down and Americans sheltered in place. The recession was short but severe, and the Trump administration responded by declaring a state of emergency and passing a $2 trillion stimulus package called the CARES (Coronavirus Aid, Relief, and Economic Security) Act. The CARES Act provided relief for businesses and individuals through stimulus payments and a pause on student loan payments, among other measures, but it was not enough to pull the economy out of the pandemic-induced recession.
Joe Biden (2021–2025)
Average Annual GDP Growth Rate: 3.2%
President Joe Biden had an annual average GDP growth of 3.2%, with a cumulative real GDP increase of 12.6% over his term, highlighted by a 5.7% growth in 2021. Biden took office in the middle of the COVID-19 pandemic and signed the American Rescue Plan Act in 2021, which was a $1.9 trillion stimulus package to provide economic relief from the pandemic.
While the recession caused by the pandemic was severe, it was short-lived. However, it was followed by record-high inflation, partly due to the Russian invasion of Ukraine, which caused soaring gas prices in 2022, supply chain snarls, higher demand for goods, and increased consumer spending from federal stimulus checks. The Federal Reserve responded by raising interest rates 11 times in an attempt to cool inflation. In July 2024, inflation cooled to 2.9%, and the Fed signaled a rate cut.
How Does the President Impact GDP?
Since GDP is the most popular way to measure economic growth, it can show us how the economy performed under each U.S. president. The economy’s performance under a president is an important factor that voters consider when evaluating a president’s time in office. Additionally, economic policies are one of the primary issues that presidents address during their campaigns.
Presidents indeed play a role in determining GDP. The president and Congress set fiscal policy to help direct the economy. The executive and legislative branches, for instance, can lower taxes and increase government spending to boost the economy, or do the opposite.
While the president plays an important role in guiding the economy, external factors that can slow down the economy—such as wars, recessions, or public health crises—also significantly impact the economy and can be out of the president’s control. In addition, the Federal Reserve—which is independent of the federal government—sets monetary policy, which influence the economy as well.
Has the US Economy Done Better Under Democrats or Republicans?
Between 1929 and 2024, there have been nine Democratic and seven Republican presidents. Eight Democrats (88%) and five Republicans (71%) maintained a GDP growth rate over 2%. If measured by GDP alone, democrats have done better than republicans with the economy.
Which President Has the Best GDP?
President Franklin D. Roosevelt had the highest average annual GDP growth rate so far, at 10.1%. However, FDR also contributed the largest percentage increase to the U.S. national debt between his New Deal initiatives and spending on World War II.
Who Owns Most of the US GDP?
According to the Bureau of Economic Analysis, the real estate, rental, and leasing industry contributed to 38% of the United States’ GDP in 2024.
The Bottom Line
Looking at GDP growth is one of the most widely used measures of economic growth, as it is considered one of the most accurate economic indicators. Since a president’s economic policies can have a significant impact on GDP, it can be used as a way to examine how the economy did under each U.S. president.
However, it is essential to remember that certain economic events, such as severe recessions, natural disasters, public health crises, and other catastrophic events, can significantly impact the economy and have little to do with who is in office. Still, the way a president, along with the central bank, sets and enacts monetary policy in response to such events also influences the economy.
Lakeland (LAKE -3.73%) reported fiscal second quarter 2026 earnings on September 3, 2025, posting record revenue of $52.5 million, up 36% year-over-year driven largely by fire services growth and recent acquisitions, and adjusted EBITDA of $5.1 million, up 90% year-over-year. Net income turned positive at $800,000 versus a $1.4 million loss in fiscal Q2 2025, but adjusted gross margin (non-GAAP) contracted to 37.4% from 41.1% a year prior due to tariffs and acquisition-related margin dilution. This analysis provides three actionable insights on strategic integration, margin management, and operational discipline taken from executive commentary and Q&A.
Acquisitions accelerate Lakeland’s revenue and market share
Recent deals, including Meridian, LHD, and Jolly, contributed $9 million of the $14 million total year-over-year revenue growth, with fire services products increasing by 113% year-over-year and comprising 47% of total revenue year-to-date. Lakeland’s exposure now spans the U.S., Europe, and Asia Pacific, and the company is actively engaged in multiple new M&A opportunities in the fire suit rental, decontamination, and services sector, especially within the United States.
“With the four recently completed acquisitions, which added product line extensions either made of new products and expanded our global footprint, We are well-positioned to grow our global head-to-toe buyer portfolio and generate long-term value for our shareholders.” — Jim Jenkins, President, CEO, and Executive Chairman
These integrations enhance Lakeland’s competitive moat in consolidated fire and industrial protective markets by creating cross-selling opportunities and recurring revenue streams.
Tariffs and acquisition mix pressure Lakeland gross margins
Adjusted gross margin fell 370 basis points year-over-year to 37.4%, primarily due to lower acquired company margins, increased material costs, new tariffs, and inventory purchase accounting impacts, though it rose sequentially by 220 basis points, primarily due to a partial reversal of purchase price variance expense and some cost reductions. Tariff effects were prominent in Latin America and caused $3.6 million in year-over-year sales declines in that region, while U.S. and European revenues soared.
“Adjusted gross profit as a percentage of net sales in the second quarter was 37.4% versus 41.1% in the comparable year-ago period but increased 220 basis points sequentially from 35.2% in the first quarter. Our adjusted gross margin percentage decreased in the second quarter for fiscal 2026 compared to the same period last year. Primarily due to lower acquired company gross margins, increased material costs, and tariffs.” — Jim Jenkins, President, CEO, and Executive Chairman
Lakeland’s near-term profitability will remain tied to its ability to offset input cost inflation and tariffs through price realization, operational efficiency, and a more favorable sales mix as newly acquired service businesses ramp up.
Lakeland ramps cost savings and working capital discipline
Operating expense reductions began contributing in the quarter, with adjusted OpEx declining 8.1% from Q1 to Q2 and identified savings of at least $1 million annualized to date for the remainder of the year; further cost initiatives are forecasted to yield an additional $3 million in annualized savings taking effect through the second half of the year. The company’s inventory balance increased 33% year-over-year to $90.2 million from $67.9 million, a key focus for improvement by optimizing working capital in line with demand and recent acquisition absorption.
“We have further identified and are executing initiatives expected to yield an additional $3 million in annualized savings. With the benefits anticipated to materialize in 2026. We believe these efforts will enable higher margins and build a more agile, and cost-effective Lakeland in the longer term.” — Jim Jenkins, President, CEO, and Executive Chairman
Disciplined cost management and inventory optimization are vital for supporting margin recovery and EBITDA growth, strengthening Lakeland’s ability to self-fund continued M&A and platform reinvestment.
Looking Ahead
Management guided revenue to the lower end of the $210 million to $220 million range for fiscal 2026, with adjusted EBITDA excluding FX between $20 million and $24 million, reflecting Latin American sales weakness and tariff-driven uncertainty. The company expects sequential improvement in gross margin and adjusted EBITDA (non-GAAP) in the third quarter, and is targeting organic growth in the high single-digit to low double-digit range over the medium term. Over the next three to five years, Lakeland aims to expand EBITDA margin into the mid to high teens, driven by efficiency gains, strategic acquisition synergies, and a more profitable business mix.
This article was created using Large Language Models (LLMs) based on The Motley Fool’s insights and investing approach. It has been reviewed by our AI quality control systems. Since LLMs cannot (currently) own stocks, it has no positions in any of the stocks mentioned. The Motley Fool has no position in any of the stocks mentioned. The Motley Fool has a disclosure policy.
AeroVironment(AVAV -2.38%), a provider of unmanned systems and defense technologies, reported results for Q1 FY2026 on September 9, 2025. The headline news was a record quarterly revenue of $454.7 million for Q1 FY2026, driven largely by the recent BlueHalo acquisition. Profit margins were compressed by large non-cash amortization and integration expenses. Overall, the quarter showcased strong top-line growth and a significant backlog expansion, but profitability and cash flow were negatively affected by integration and acquisition costs.
Metric
Q1 FY2026(Three Months Ended Aug 2, 2025)
Q1 FY2025(Three Months Ended July 27, 2024)
Y/Y Change
EPS (Non-GAAP)
$0.32
$0.89
(64.0%)
Revenue (GAAP)
$454.7 million
$189.5 million
140.0%
Gross Margin
$95.1 million
$81.5 million
16.7 million
Adjusted EBITDA (Non-GAAP)
$56.6 million
$37.2 million
52.2% (rounded to one decimal place: 52.2%)
Funded Backlog (End of Period)
$1.1 billion
N/A
N/A
Business Overview and Strategic Priorities
AeroVironment is known for developing unmanned aircraft systems, robotic platforms, and defense technologies used by military and government customers. Its core strength lies in autonomous systems, including drones and related products like Switchblade loitering munitions. The BlueHalo acquisition immediately broadened AeroVironment’s focus into new areas such as directed energy (energy weapons), space technologies, cyber solutions, and advanced radio frequency (RF) and electronic warfare (EW) systems.
The company’s current strategy centers on innovation, integrating advanced technologies from BlueHalo, and meeting the evolving requirements of defense customers. Key performance drivers are its ability to win and scale large government contracts, continuous product development in areas such as artificial intelligence-enabled drones and electronic warfare, and the efficiency with which it integrates acquisitions and expands production capacity. Strong relationships with the U.S. Department of Defense and allied governments are also a cornerstone of AeroVironment’s business, guiding both growth and technology investment.
Quarterly Results and Developments
The quarter set a new revenue record primarily because of the BlueHalo acquisition, which closed on May 1, 2025. Legacy AeroVironment grew its organic revenue by 16%. The result reflected both acquisition-driven expansion and organic demand for the company’s established unmanned systems.
Performance by business segment revealed most profit contribution continued to come from the Autonomous Systems area. That segment, which includes legacy drone and loitering munitions products as well as BlueHalo’s unmanned offerings, posted $285.3 million in revenue. The newly created Space, Cyber and Directed Energy segment brought in $169.4 million in revenue, but margins there lagged as integration continued. The revenue figure represents a sharp acceleration from the prior year. Management reported that these results meant “Record revenue of $454.7 million, up 140% year-over-year; legacy revenue of $219.5 million up 16% year-over-year”
Despite the revenue growth, gross margin dropped to 21% from 43% in the prior year, a significant decline. Management attributed this to high purchase accounting adjustments, $37.4 million in non-cash intangible amortization, and a much larger portion of service revenue, which tends to have lower profit margins than product sales. Operating expenses rose sharply as well, particularly selling, general and administrative costs associated with the acquisition and integration work, which were $97.5 million higher than last year. As a result, the company posted a loss from operations of $69.3 million, compared to a $23.1 million operating profit in Q1 FY2025.
Earnings per share on a non-GAAP basis dropped to $0.32, down 64% from $0.89 in Q1 FY2025. The decrease was due to both higher costs—especially amortization and acquisition charges—and dilution resulting from the increase in shares outstanding after the BlueHalo transaction. Adjusted EBITDA, which removes many of the acquisition-related charges, increased by over 50%, indicating some underlying improvement in core cash-generating ability when nonrecurring costs are excluded. Net cash outflow from operations was $123.7 million, compared to an inflow of $28.4 million in Q1 FY2025. The cash balance, however, rose sharply to $685.8 million as a result of financing tied to the BlueHalo deal.
The acquisition also transformed the company’s future business visibility. Funded backlog at the end of the period reached a record $1.1 billion, up from $726.6 million as of April 30, 2025. This reflects both the strong order book brought by BlueHalo and continued high demand for the company’s legacy unmanned systems portfolio. Bookings totaled $399 million. Management stated that, as of September 9, 2025, AeroVironment had “Visibility of 82% to the midpoint of the FY2026 revenue guidance range” This means a large part of the year’s projected revenue comes from orders already in hand, providing a measure of predictability for the next several quarters.
The company continued to invest in research and development (R&D), with R&D expenses rising to $33.1 million. This maintains AeroVironment’s longstanding focus on developing new technologies for defense customers. Among the newer offerings are the P550 unmanned aircraft system (an artificial intelligence-driven modular drone), the JUMP 20X (a vertical takeoff and landing drone), and Red Dragon (an autonomous, single-use drone). BlueHalo’s specialties in advanced RF, directed energy, and space-qualified electronics add significant new competencies, and management expects ongoing integration of these capabilities to open further market opportunities. Still, the cost and complexity of absorbing such a large acquisition have introduced execution risk, both operationally and financially.
The period also saw significant balance sheet changes. Total assets grew to $5.6 billion, up dramatically from $1.1 billion as of Q4 FY2025, mostly due to the addition of goodwill and intangibles from the BlueHalo transaction. Share count rose by 77% between April 30, 2025, and August 2, 2025, and long-term debt increased from $30.0 million as of April 30, 2025, to $725.7 million as of August 2, 2025. The capital raised provides flexibility but also brings a substantial increase in financial leverage and dilution for existing shareholders.
AVAV does not currently pay a dividend.
Looking Ahead: Outlook and Watchpoints
For FY2026, management maintained its previous revenue outlook of $1.9 billion to $2.0 billion. It projects continued losses, with a net loss of $77 million to $72 million for FY2026, and a loss per share of between $1.63 and $1.53. On an adjusted basis—removing non-cash and non-recurring expenses—management expects EBITDA in a range of $300 million to $320 million, and non-GAAP earnings per share of $3.60 to $3.70. The company stated that visibility to the revenue midpoint stood at 82% as of September 9, 2025. But actual profitability may remain pressured until integration costs and purchase accounting impacts begin to diminish.
Key areas for investors to monitor include the pace and effectiveness of integrating BlueHalo, control of operating and working capital expenses, and the conversion of the record backlog and bookings into profitable future revenue. Management flagged that intangible asset amortization will continue to weigh on reported earnings until those assets are fully written down over several years, and cash flow from operations will require careful management as receivables and inventories expand alongside the larger business. Defense-contract timing risks and strong competition from larger established players remain watchpoints. The scale of the recent acquisition means that AeroVironment’s performance over the next several quarters will be closely tied to its ability to deliver on the promise of its expanded technology portfolio while navigating higher operating complexity and integration challenges.
Revenue and net income presented using U.S. generally accepted accounting principles (GAAP) unless otherwise noted.
This AI cloud company stock has been a stealth winner this year.
Iren Limited(IREN 15.41%) stock has been quietly making shareholders richer this year. Today’s jump came after a big deal was announced in the artificial intelligence (AI) cloud infrastructure space.
Today, Iren shares spiked higher by 15.8% as of 3:08 p.m. ET. But Iren stock has been stealthily moving higher all year. Shares of the vertically integrated data center company have more than tripled year to date.
Image source: Getty Images.
The demand for AI infrastructure is soaring
The AI cloud infrastructure space is gaining headlines today after a huge deal between Microsoft and AI infrastructure company Nebius Group was announced. The deal could be worth up to $19.4 billion for Nebius, which had a market cap of just about $15 billion yesterday.
Previously known as a power provider for Bitcoin mining, Iren has shifted into AI cloud services at a time when demand is soaring. Iren has accumulated leading Nvidia chips to provide customers with AI cloud services.
In an August business update yesterday, Iren co-founder and co-CEO Daniel Roberts stated, “Demand for our AI Cloud is accelerating as we prepare for the delivery of approximately 9,000 Nvidia Blackwell GPUs [graphics processing units] over the coming months.”
Since the Nebius deal was announced, more investors are noticing Iren today. That’s after the stock more than tripled year to date, though.
Iren also announced the appointment of a new chief financial officer yesterday. Anthony Lewis seems like a logical pick, as he oversaw financing for Iren’s recently announced GPU chip purchases.
Iren’s market cap is around $8 billion after today’s jump. Its data center capacity is approaching 1 gigawatt. If it manages to secure a similar deal with a large tech company, investors are betting that its valuation can also grow quickly from here.
Howard Smith has positions in Microsoft, Nebius Group, and Nvidia and has the following options: short October 2025 $160 calls on Nvidia. The Motley Fool has positions in and recommends Microsoft and Nvidia. The Motley Fool recommends Nebius Group and recommends the following options: long January 2026 $395 calls on Microsoft and short January 2026 $405 calls on Microsoft. The Motley Fool has a disclosure policy.
For now, the “Magnificent Seven” and select others remain the most popular names in the AI arena.
Over the last few years, companies like Nvidia, Amazon, Alphabet, Microsoft, and Meta Platforms dominated the narrative around artificial intelligence (AI). As the conversation shifted beyond chips and into adjacent applications in data centers and software, names such as Broadcom, Taiwan Semiconductor Manufacturing, and Palantir Technologies also stepped into the spotlight.
It’s no secret that the AI trade remains heavily concentrated within a small circle of big tech giants. But savvy investors know that opportunity doesn’t end with the usual suspects.
So here’s the question: Have you heard of Nebius Group(NBIS 49.20%)? If not, you’re not alone.
This sprawling data center company has flown under the radar — but its unique position in the AI ecosystem could propel it into the spotlight and make it a household name very soon.
Nebius took an unconventional route to the AI revolution
Unlike many of its louder peers, Nebius did not emerge as a flashy start-up or an established tech titan already entrenched in the AI race. Instead, the company traces its roots back to Yandex — a Russian internet conglomerate.
As geopolitical tensions from the Russia-Ukraine war escalated, Yandex moved to divest its noncore assets. From that process, Nebius was spun off, and it was listed on the Nasdaq exchange last October.
Soon after, Nebius completed a capital raise that attracted a particularly notable participant: Nvidia. The undisputed leader in AI chips not only became an investor but also established itself as a strategic ally — lending Nebius a level of credibility that few companies can claim.
At its core, Nebius can be considered a neocloud — a business specializing in building AI infrastructure by constructing data centers and renting out Nvidia’s sought-after graphics processing units (GPUs) to other businesses via the cloud. This model positions Nebius to scale up in lockstep with Nvidia, benefiting as next-generation chips like Blackwell and Rubin enter the market.
Image source: Getty Images.
Nebius is more than GPUs
While infrastructure is its core business, Nebius operates several subsidiaries and also has notable strategic investments.
Toloka is in the business of data labeling, an important component of training datasets for AI models. The company also has exposure to autonomous driving systems and robotics through Avride and maintains a software platform called TripleTen that specializes in educating developers across various AI applications.
Nebius also has an equity stake in ClickHouse, an open-source database management and analytics system.
This diversified ecosystem positions Nebius beyond chips and provides the company with exposure to a number of potentially trillion-dollar ancillary markets as AI workloads become larger and more advanced.
Is Nebius stock a buy right now?
In December 2024, Nebius’s core infrastructure segment closed the year with an annualized run rate of $90 million. Just two quarters later (by June 30), the company’s annual recurring revenue (ARR) run rate surged to $430 million. Even more compelling is that management recently raised full-year guidance to a range of $900 million to $1.1 billion from its prior outlook of $750 million to $1 billion.
On Sept. 8, however, everything changed for Nebius as news broke that the company signed a massive new deal with Microsoft. According to regulatory filings, Nebius “will provide Microsoft access to dedicated GPU infrastructure capacity” at its data center in New Jersey. The contract is worth $17.4 billion and runs through 2031.
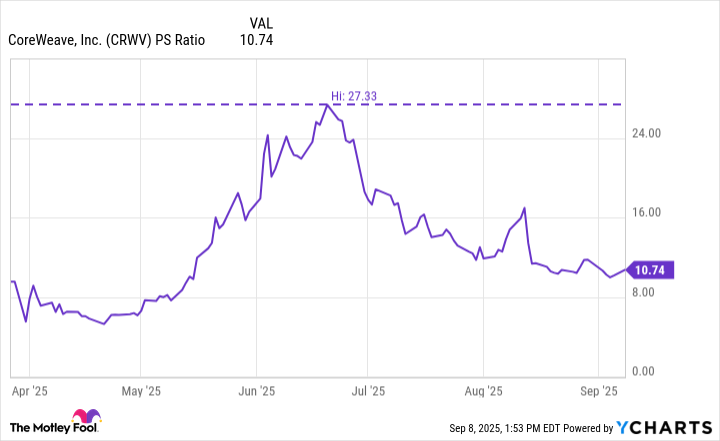
Prior to the deal with Microsoft, Nebius boasted a market capitalization of $15.4 billion — implying a forward price-to-sales ratio of about 14 at the high end of its ARR forecast. For context, that’s about half the multiple CoreWeave commanded at its peak earlier this year following its much-hyped initial public offering.
This suggests a couple of takeaways. On one hand, Nebius’s valuation has been swept up in the broader bullish AI narrative — leaving traces of froth. On the other, the stock has remained relatively insulated from the sharp pullbacks seen in more volatile peers like CoreWeave — a dynamic that could play in its favor as it continues to fight for mindshare in an increasingly crowded and competitive market.
Looking ahead, Nebius appears positioned to benefit from secular tailwinds fueling AI infrastructure. Microsoft’s new deal emphasizes that cloud hyperscalers are showing no signs of slowing their capital expenditure, and Nebius is already steadily carving out a role as a beneficiary of that spending.
I think Nebius will be trading materially higher than it is today by next decade as its relationship with Microsoft matures. That makes it, in my view, a compelling buy-and-hold opportunity.
Adam Spatacco has positions in Alphabet, Amazon, Meta Platforms, Microsoft, Nvidia, and Palantir Technologies. The Motley Fool has positions in and recommends Alphabet, Amazon, Meta Platforms, Microsoft, Nvidia, Palantir Technologies, and Taiwan Semiconductor Manufacturing. The Motley Fool recommends Broadcom and Nebius Group and recommends the following options: long January 2026 $395 calls on Microsoft and short January 2026 $405 calls on Microsoft. The Motley Fool has a disclosure policy.
Cognyte(CGNT -12.29%) reported second-quarter fiscal 2026 results on Sept. 9, 2025, with revenue rising 15.5% year over year to $97.5 million and adjusted EBITDA increasing 33% to $11 million. Management raised full-year guidance, now projecting $397 million in revenue (up 13% year over year at midpoint) and $45 million in adjusted EBITDA, while reiterating a $500 million revenue target for the fiscal year ending Jan. 31, 2028, and signaling continued margin expansion.
The following analysis highlights execution on strategic wins, margin expansion, and the path to U.S. market growth.
Major military intelligence wins accelerate Cognyte’s momentum
Cognyte secured two $10 million deals with military intelligence customers in Asia-Pacific and EMEA, including a successful displacement of a regional incumbent in EMEA. New business wins contributed to short-term remaining performance obligations (RPO) increasing to $355 million, supporting 12-month revenue visibility amid heightened global security spending.
“In Asia-Pacific, we signed a $10 million follow-on deal with a longstanding customer. They operate in a complex border environment and use our border security solutions to stop infiltration attempts by hostile actors, clear proof of the ongoing trust they place in us and the tangible operational results we deliver. In EMEA, we won a competitive deal worth about $10 million with a new Tier 1 military intelligence organization, beating several global vendors, including the regional incumbent. They chose Cognyte Software Ltd. for our proven tactical intelligence solutions to modernize operations and address emerging threats.” — Elad Sharon, CEO
Winning large, competitive contracts and demonstrating follow-on demand validate the company’s technology differentiation and strengthen the long-term growth narrative through increased market share in core government verticals.
Gross margin expansion demonstrates operational leverage at Cognyte
Non-GAAP gross margin improved to 72.1%, expanding 81 basis points year-over-year, while non-GAAP gross profit increased 16.8% year-over-year to $70.3 million. Annual non-GAAP gross margin guidance was raised to 72%, with a new long-term target of 73% non-GAAP gross margin for the fiscal year ending Jan. 31, 2028, driven by a software revenue mix projected to reach 87% in fiscal 2026.
“Our total software revenue for the quarter was approximately $83.3 million, representing 85.5% of total revenue. We continue to expect software revenue to be about 87% of total revenue on an annual basis.” — David Abadi, CFO
Sustained mix shift toward higher-margin software, and disciplined cost management, improve profitability, signaling the company’s capacity to drive long-term free cash flow generation and strategic reinvestment without impairing financial flexibility.
U.S. expansion strategy advances but remains a future growth lever
Despite the U.S. accounting for a small portion of current revenue, the company highlighted recent state and local customer acquisitions, the start of a strategic LexisNexis Risk Solutions partnership, and successful proof-of-concept (POC) engagements with federal agencies in the U.S. Management reiterated that budget constraints and procurement delays in U.S. federal markets are built into guidance, but confirmed strong product-market fit and growing partner interest.
“The U.S. represents a significant opportunity for us, given that it’s a large territory with many security agencies. We continue to make investments in order to expand presence, increase market reach, expand the partner network, and invest more in marketing. Having said that, in the shorter term, the U.S. presents a small portion of our business, so we are not relying in our guidance heavily on the U.S. We do believe that the U.S. will become a more significant portion of our business over time.” — Elad Sharon, CEO
Cognyte’s measured U.S. go-to-market investments, combined with low near-term guidance dependence, preserve upside optionality, allowing the company to capture growing demand as federal agency budget normalization occurs over the next several years.
Looking Ahead
Management projects approximately $397 million in revenue for fiscal 2026 (plus or minus 2%), $45 million in adjusted EBITDA, 72% non-GAAP gross margin, and $0.23 in annual non-GAAP EPS. Sequential quarterly revenue growth is expected in both Q3 and Q4. Strategic financial targets for the fiscal year ending Jan. 31, 2028, remain unchanged, including $500 million in revenue, a 73% gross margin target, and adjusted EBITDA margins above 20%.
Motley Fool Markets Team is a Foolish AI, based on a variety of Large Language Models (LLMs) and proprietary Motley Fool systems. The Motley Fool takes ultimate responsibility for the content of these articles. Motley Fool Markets Team cannot own stocks and so it has no positions in any stocks mentioned. The Motley Fool has no position in any of the stocks mentioned. The Motley Fool has a disclosure policy.
You’re reading a free article with opinions that may differ
from The Motley Fool’s Premium Investing Services. Become a Motley Fool member today to get instant access to our top analyst recommendations, in-depth research, investing resources,
and more. Learn More
Uber’s strong performance has silenced the critics.
Uber Technologies(UBER -0.48%) might be a household name these days, with its global reach supporting strong brand recognition. However, it’s taken shareholders on a volatile journey since its initial public offering more than six years ago. For instance, the stock declined 18% in 2021, followed by a 41% drop in 2022.
But Uber’s stock chart has been moving up and to the right in recent years. If you’d invested $10,000 in the company’s shares five years ago, not long after the onset of the COVID-19 pandemic, here’s how much you’d have today.
Image source: Getty Images.
Driving in the fast lane
After the pandemic hit, Uber’s business, at least on the mobility side, was decimated. Its delivery operations picked up the slack. Since then, however, the company has been thriving, and investors have reaped the rewards.
In the past five years, Uber shares have soared 174% (as of Sept. 5). Had you bought $10,000 worth of stock in early September 2020, you’d be staring at a position valued at $27,400 today. This gain comes even though Uber trades 7% below its all-time high from July.
Business is booming
In the latest quarter (Q2 2025 ended June 30), Uber reported gross bookings of $46.8 billion. This figure was up a remarkable 359% compared to exactly five years before. The company’s user base has also expanded significantly. Unsurprisingly, these trends have lifted revenue and operating income to new heights.
Even after such a stellar performance, the shares don’t look expensive, as they trade at a forward price-to-earnings ratio of 23.5. Investors should consider buying the stock, although it’s best to set realistic expectations. Don’t anticipate another 174% gain between now and 2030.
Neil Patel has no position in any of the stocks mentioned. The Motley Fool has positions in and recommends Uber Technologies. The Motley Fool has a disclosure policy.
Core & Main (CNM -23.40%) reported its fiscal second quarter ended Aug. 3, 2025, earnings on September 9, 2025, lowering full-year revenue and EBITDA guidance for fiscal 2025 due to unexpected residential market weakness but highlighted resilient municipal demand and progress on cost containment. Residential sales are now expected to decline by low double digits through the end of 2025, offset by strength in municipal and select non-residential segments, with SG&A initiatives and M&A synergies anticipated to yield greater benefits in fiscal 2026. The following insights synthesize management commentary on growth drivers, operating leverage, and strategic execution directly affecting Core & Main’s long-term investment outlook.
Municipal strength offsets Core & Main’s residential weakness
Municipal water infrastructure demand remains robust due to increased funding and a multi-year replacement cycle, providing resilience against cyclical residential softness. Management noted positive momentum in treatment plants and high-density polyethylene (HDPE) product lines, while municipalities benefit from improved rates and healthy local budgets.
“The municipal market remains strong with ample funding, and we’re seeing a lot of demand there too. Those are kind of the puts and takes on the top line with the revised guide.” — Robyn Bradbury, CFO
This dynamic illustrates the company’s balanced end-market exposure and positions Core & Main to capture secular growth from public infrastructure investment even as near-term residential lot development decelerates.
Margin management actions to drive 2026 profitability
SG&A (selling, general, and administrative) expenses rose 13% year-over-year, with about half attributable to M&A and one-time costs, while controllable spend reduction efforts and synergy realization from prior acquisitions are ongoing. Specific inflation-driven areas, such as insurance and compensation, contributed significantly to cost headwinds, but targeted workforce management and cost-out actions have been implemented, with major benefits expected beyond 2025.
“Some of those inflation items were a lot higher than we were expecting, and that’s what we need to work to offset. We’ve got several million dollars of cost-out actions that have been executed in the first half of the year. I would say we’ve got a meaningful amount of actions that are in process that we’re working through.” — Robyn Bradbury, CFO
Core & Main expands Canadian footprint to unlock new growth
The company completed a three-branch acquisition in Canada, building on its earlier entry into the market and setting a platform for both greenfield branch expansion and further local M&A. Each acquired Canadian branch carries an approximately $15 million revenue run rate, diversifying the company’s geographic revenue base and advancing its multi-lever growth strategy beyond the U.S. market.
“the acquisition we did in Canada was a three-branch acquisition with two locations around Toronto and another one in Ottawa. Those, I would say, those branches are typical kind of branch size for us in kind of the $15 million range. Really excited about that one. It really builds a great platform for us to grow from in Canada. That’s now the second acquisition we’ve completed there.” — Mark Witkowski, President
This cross-border expansion signals increasing addressable market opportunity and serves as a meaningful long-term complement to Core & Main’s organic U.S. pipeline.
Looking Ahead
Residential sales for the full year are forecast to decline by low double digits through the end of 2025, with municipal and select non-residential segments maintaining positive momentum. Gross margin rate is expected to remain stable versus fiscal second quarter ended Aug. 3, 2025, levels for the remainder of fiscal 2025, while SG&A expenses are projected to decrease in the second half of fiscal 2025 due to cost actions, with the bulk of synergy and efficiency gains materializing in fiscal 2026. Management confirmed the recent Canadian acquisition is not included in current guidance and referenced a strong M&A pipeline as a continued strategic focus.
This article was created using Large Language Models (LLMs) based on The Motley Fool’s insights and investing approach. It has been reviewed by our AI quality control systems. Since LLMs cannot (currently) own stocks, it has no positions in any of the stocks mentioned. The Motley Fool has no position in any of the stocks mentioned. The Motley Fool has a disclosure policy.
As cyberattacks and privacy breaches mount, Nordic nations are leading the move to recalculate how digital-dominant economies operate.
The global shift toward cashless payments—a shift driven by speed, convenience, and digital innovation—has gained significant momentum in recent decades. The Covid-19 pandemic and the preference of younger generations for digital transactions have led many to consider a cashless society inevitable.
However, recent wars, natural disasters, and other crises have revealed vulnerabilities in fully digital systems. This has prompted a global reassessment of the significance of physical cash. Increasingly, governments, central banks, and technologists are endorsing a hybrid payments model that combines the benefits of digital transactions with the resilience, privacy, and inclusivity offered by physical money.
No region has embraced the cashless future quite like the Nordic nations. Sweden, in particular, has developed a largely digitalized economy. Sweden and Norway have the world’s lowest amount of cash in circulation as a share of GDP, according to Sweden’s Riksbank. Currently, about one-tenth of in-store purchases in Sweden are made with cash, compared to about one-half in the euro area.
Magnus Lageson, chief product officer at Sweden’s Crunchfish Digital Cash, has not used cash for over 10 years, he tells Global Finance. “The younger generations, like my kids who are 17 and 19, have never used cash in Sweden—and it’s the same for everyone in their generation,” he says.
Recently, however, the Nordic countries have begun to reassess their nearly cashless societies. One immediate concern is the Ukraine-Russia war and the threat of Russian hybrid warfare that might include cyberattacks and assaults on power grids and telecom infrastructure. In situations where electricity is lost, digital payment systems may fail.
Last November, Sweden’s government distributed a brochure entitled “In Case of Crisis or War” to all households. This brochure advised Swedes to keep on hand “enough cash for at least one week, preferably in different denominations.”
Norway has similarly advised its citizens to maintain a supply of physical cash, because digital payment systems are vulnerable to cyberattacks from abroad. Last year, legislation was passed to make it easier for Norwegians to use cash. Finland has also encouraged its citizens to prepare an “emergency home kit” that should include a small amount of cash in case of disruptions to payment systems.
There are several reasons why Sweden, Norway, Finland, and other nations may want to retain a cash option. Cash transactions are private, whereas digital payments, especially within a central bank digital currency (CBDC) framework, may allow for government monitoring, such as tracking purchasing habits and locations.
Additionally, marginalized groups, including low-income individuals, still rely on cash for their daily transactions. Not everyone owns a smartphone or has a bank card.
New Zealand Flips The Switch
In February 2023, Cyclone Gabrielle knocked out power and telecom systems across vast areas of New Zealand. Many bank ATMs and other electronic payment infrastructure went dark, leaving people unable to pay for essential items like water and food for days in some regions.
The impact of Cyclone Gabrielle highlighted the importance of cash as a reliable payment option during community-level or national emergencies, as Karen Silk, assistant governor at the Reserve Bank of New Zealand (RBNZ), tells Global Finance. The country is proceeding with a pilot program aimed at developing digital cash for citizens and businesses. This would function similarly to traditional physical cash.
India, concerned about its unbanked population, has developed an offline digital payment system called UPI 123PAY, which allows users to perform transactions without an active internet connection. However, the system still requires at least a feature phone.
A study published by the European Central Bank (ECB) in December revealed that most euro-area consumers still consider having cash as a vital payment option. This sentiment has increased over the past few years, rising from 60% in 2022 to 62% in 2024. Remarkably, even among young people aged 18-24, 55% consider the option to pay with cash at least “fairly important.”
“The march toward a cashless society is not inevitable,” says Jay Zagorsky, a professor at Boston University’s Questrom School of Business and author of The Power of Cash: Why Using Paper Money Is Good for You and Society, in an interview with Global Finance. “I think that once people understand that paper money has many benefits—from ensuring privacy to reducing the price people pay to protecting them from natural disasters—cash will enjoy a rebound.”
Ignazio Angeloni, a former ECB official and current fellow at Milan’s Bocconi University, expresses his satisfaction with the renewed respect for cash. “I was always convinced that physical cash should be part of a diversified and robust payment ecosystem,” he says. “I am glad to see that an increasing number of people and institutions share this view.”
‘Only Elderly People Still Use Cash’
Tory Jackson, Head of Business Development and Strategy, Galileo Financial Technologies
Not all economists, policymakers, and central bankers share Zagorsky’s optimism about cash use. Paul De Grauwe, a professor at the London School of Economics and a former member of Belgium’s Federal Parliament, notes, “The use of coins and paper money is declining inexorably. Only elderly people still use cash. I think this trend is not going to stop.”
The convenience of digital payments cannot be overlooked. For instance, 29 out of 30 professional football stadiums in the US have gone cashless. The growing length of concession lines largely drove this decision. Handling cash—making change and counting bills—was slowing down service, leading many fans to forgo food and drinks rather than wait. By banning cash, stadiums created a win-win for fans and vendors alike.
In Latin America, digital payments are increasingly the preferred option for many consumers, both online and offline, according to Tory Jackson, head of business development and strategy for Latin America at Galileo Financial Technologies. Cash accounted for 57% of consumer-payment volume in the region in 2022, including the informal economy, reports Payments and Commerce Market Intelligence (PCMI). That figure has since dropped to 37%.
There is a prevailing sense of inevitability regarding the shift toward digital payments. As Crunchfish’s Lageson puts it, “The future is cashless; there is no turning back.”
But maybe it’s not so inevitable.
Are Digital Systems Too Fragile?
The Nordic countries were pioneers in digital payments, but they may be reaching the limits of a cashless society.
Vitalik Buterin, a co-founder of Ethereum, recently commented, “[The] Nordics are walking back the cashless society initiative because their centralized implementation of the concept is too fragile. Cash turns out to be necessary as a backup.”
Currently, digital payments rely on three legs: electricity, communications, and computers. All three must work all the time for digital transactions to occur, Zagorsky points out. In a cashless system, adversaries can disrupt the economy by targeting any one of these legs—whether by attacking the power grid, cutting telephone cables, or hacking payment-system servers.
Arina Wischnewsky, Economist, Research and Teaching Associate, Trier University
A more practical solution that many central banks are advocating is a hybrid system: using digital transactions as the default option while maintaining cash as a parallel system to ensure privacy, accessibility, and contingency planning, says Arina Wischnewsky, an economist and a research and teaching associate at Trier University in Germany.
“A completely cashless society has always been more of a theoretical ideal than a realistic short- to medium-term goal,” Wischnewsky says. “The idea of completely abandoning physical cash is increasingly viewed as both risky and exclusionary, particularly in light of financial-inclusion and crisis-resilience concerns.”
Are Offline Digital Payments Viable?
In April, the Bank of England (BoE) released a report evaluating the feasibility of implementing offline payment functionality for a yet-to-be-created digital pound sterling. This option “might provide additional resilience in the event of network disruption or outage of telephony services, and support financial inclusion and certain payment use cases, such as transportation,” the central bank proposed. Several technology companies, including Thales, Secretarium, Idemia Secure Transactions, Quali-Sign, and Consult Hyperion, submitted prototypes to the BoE.
In a similar vein, the ECB issued a substantial tender in 2024 for fintech companies to develop a digital euro with offline capabilities.
Piero Cipollone, a member of the ECB executive board, emphasizes the importance of maintaining payment options. “The inability to use physical cash in online transactions or for digital payments at the point of sale deprives us of a key payment option, reducing resilience, competition, sovereignty, and ultimately, consumers’ freedom to choose how to pay,” he stated in a recent speech to the Committee on Economic and Monetary Affairs of the European Parliament.
New Zealand’s projected digital cash solution would be Bluetooth-powered, enabling store purchases even when the power grid or wireless towers fail. Today, New Zealanders can’t make instant payments electronically to each other “unless they are both with the same bank,” says Silk.
None of these solutions has been implemented at scale, however. The BoE project demonstrated that while an offline digital pound might be technically feasible, there are questions about “security, performance, and user experience challenges which need to be explored further,” and particularly “security challenges related to double spending and counterfeiting.”
Keir Finlow-Bates, CEO and founder of blockchain research and development firm Chainfrog, says that the technical challenges of offline electronic cash aren’t dissimilar to those faced years earlier by cryptocurrency developers. In a 2024 blog post, he references the “double-spend” problem. “How does one make a digital construct behave like a physical object so that only one person can own it at a time? That is the core problem when designing and implementing offline digital cash.”
Wischnewsky acknowledges that offline private digital transfers are technically possible and that many projects, including offline CBDCs, show promise. Still, “These solutions are not yet mature, widely scalable, or secure enough for full deployment in a [national] payment system.”
The benefits could be tantalizing, though. “Choosing to pay with an ‘offline digital euro’ would allow you to maintain a level of privacy that is close to cash,” writes Maarten G.A. Daman, data protection officer at the ECB, in a post on The ECB Blog. “You could pay a friend for your share of a dinner, and only you and your friend would know the payment information. How? You would simply both have the digital euro app on your smartphones and hold them next to each other to transfer the money.”
Not only could the offline option allay privacy concerns, it could also ensure that the poor, elderly, or geographically isolated members of society aren’t further disadvantaged. This last group is of particular concern for China’s government, whose digital yuan is nearing full rollout.
“Cash remains an integral component of consumer payments, especially among China’s rural and semiurban population,” Kartik Challa, senior banking and payments analyst at GlobalData, tells Global Finance. “Offline payments could be a key bridge for inclusivity in a cashless society.”
Nvidia has largely dominated the artificial intelligence (AI) narrative over the last few years thanks to its combination of leading chips and software.
Over the past few years, Nvidia has cemented its position as the undisputed leader in artificial intelligence (AI). Its graphics processing units (GPUs) are more than just hardware — they serve as the foundation of a tightly integrated ecosystem built on the CUDA programming architecture.
CUDA transformed Nvidia’s chips from a commoditized product into a comprehensive infrastructure layer for AI developers. Simply put, if you want to train high-quality AI models, chances are you’re doing it with Nvidia’s hardware and software.
Image source: Getty Images.
Alphabet(GOOGL -0.31%)(GOOG -0.35%) may be charting a similar path in quantum computing. Through a series of strategic moves in recent years, the company is laying the groundwork to become the Nvidia of quantum platforms.
Building the hardware foundation like Nvidia’s GPUs
Nvidia’s GPUs were the gateway for developing the CUDA framework. Alphabet’s parallel effort on the hardware side centers on its tensor processing units (TPUs) and its research into superconducting quantum processors (i.e. Willow). While TPUs are not quantum devices, they highlight Google’s capability to design custom silicon tailored for new, increasingly sophisticated computational needs.
The company’s Sycamore processor — which demonstrated quantum supremacy in 2019 — provided a proof-of-concept that its approach to building quantum hardware was viable. Since then, Alphabet has poured years of investment into refining its AI and quantum stacks — assembling the engineering talent and technological expertise to iterate on architectures until they achieve practical utility.
Much like Nvidia’s cycle of GPU innovation, Alphabet is positioning itself to develop successive generations of quantum processors that can be paired with proprietary systems and software — creating an integrated ecosystem just as Nvidia has.
Cirq could be Alphabet’s version of CUDA
Hardware alone rarely creates a durable moat. Nvidia’s true competitive advantage comes from its one-two punch of GPUs and CUDA. This combination has created a powerful lock-in effect, making the switching costs to competing platforms — even those with lower upfront investment — extremely steep. Once developers build and optimize their models on CUDA, abandoning Nvidia’s walled garden becomes almost unthinkable.
Alphabet is pursuing a similar strategy in quantum computing, though with a different design philosophy. Its analogue to CUDA is Cirq — an open-source quantum programming framework the lets developers build and run applications across multiple backends. Unlike CUDA, Cirq does not tie developers exclusively to Google’s hardware. In fact, platforms such as Microsoft Azure and IonQ already integrate with Cirq, underscoring its interoperability.
Paradoxically, this openness may strengthen Alphabet’s position. By fostering a larger community of developers who become fluent in Cirq — even outside of Google’s hardware stack — the company is ensuring that when its own quantum applications reach commercial scale, an ever-growing developer base is already aligned with its tools.
In other words, while Nvidia’s moat is supported by tight integration, Alphabet is cultivating an ecosystem anchored in accessibility and collaboration — an open framework that could become just as sticky, but drawing developers in voluntarily rather than lock-in.
DeepMind: The path to unlock valuation expansion
While CUDA has been the foundation of Nvidia’s dominance, the company’s success ultimately hinged on widespread external adoption and validation by developers.
Alphabet, by contrast, already controls one of the world’s premier AI research labs — DeepMind — which gives it a built-in feedback loop to stress-test its quantum algorithms, refine Cirq, and push next-generation processors like Willow forward more quickly.
This vertical integration across research, hardware, and software mirrors the Nvidia GPU-CUDA dynamic that made it indispensable to AI development. Nvidia’s ecosystem has translated into years of explosive revenue growth, expanding profit margins, and record valuation expansion.
Alphabet appears to be deploying a similar playbook — but adapted for the quantum era. Instead of a closed system, Alphabet is building an open, yet sticky, ecosystem designed to attract developers by choice and create a powerful gravitational pull around its platform.
For investors, the takeaway is clear. As AI workloads grow more complex and quantum computing inches closer to real-world utility, Alphabet is positioned to drive and monetize this shift at scale.
Long-term investors should view Alphabet not just as a leader of today’s technology landscape, but one that is at the forefront of the next frontier of AI. I think that buying and holding Alphabet stock offers exposure to a potential Nvidia-like return over the next several years.
Adam Spatacco has positions in Alphabet, Microsoft, and Nvidia. The Motley Fool has positions in and recommends Alphabet, Microsoft, and Nvidia. The Motley Fool recommends the following options: long January 2026 $395 calls on Microsoft and short January 2026 $405 calls on Microsoft. The Motley Fool has a disclosure policy.
Despite political turmoil and global uncertainties, Poland anticipates several years of strong growth will continue.
Anyone looking for proof of Poland’s enduring investment appeal found it following the June 1 presidential election, which saw the right-wing Law and Justice Party candidate Karel Nawrocki narrowly defeat the governing Civic Platform’s Rafal Trzakowski. Instead of pulling back amid fears that Prime Minister Donald Tusk’s policies would be slowed, and political divisions deepen, investors remained upbeat.
The stock market, which has been one of the world’s best performing this year, continued its record streak as the WIG Index went into early August 35% above its August 2024 mark. Shares in oil and gas producer Orlen rose 60% over that period while supermarket chain Dino and insurance company PZU both saw their share price rise more than 30%. Instead of holding firm given the economic uncertainties, the National Bank of Poland cut base interest rates to 5%, with another 25-basis point cut anticipated for September, as inflation continued its downward path.
All this reflects the resilience the Polish economy has built up over the last decade, especially pre-pandemic, when GDP growth averaged 5% a year and annual inflows of foreign direct investment typically up to 4% of GDP.
“With Poland the fastest growing economy in the region—we forecast 3% GDP growth this year and next, rising to 3.1% in 2027—our sovereign rating is A- with Stable Outlook, a level we’ve held steady for 18 years,” says Milan Trajkovic, associate director, Fitch Ratings. The size of the economy—37 million people—its diversity, and the fact that it is not overly dependent on US exports; a slowing, tariff-sensitive auto industry; or the softening German economy are all positives, he adds.
According to UNCTAD, between 2000 and 2023, Poland attracted over $335 billion in foreign investment, almost half the combined total for the eight Central and Eastern European (CEE) states that joined the EU in 2004. Poland has been particularly successful at near-shoring, thanks to its well-educated workforce, developed infrastructure, diversified economy, and close integration with the EU.
As Finance Minister Andrzej Domański pointed out in an article for the International Monetary Fund from this June, the EU has been very good for Poland as its membership in the Single European Market has facilitated rapid technology transfer and opened the way for exports to grow to almost 3.5 times their previous level.
Indeed, the Polish Economic Institute has calculated that European integration boosted GDP by 40% over what it would have posted had Poland not joined the EU.
The nation also holds the CEE regional record in spending EU funds, led by funds distributed under the National Recovery and Resilience Plan (NRRP). Some €60 billion (about $70 billion) scheduled through the end of 2026, including €25.3 billion in grants and the rest in preferential loans, will be available to Poland under this facility, a big chunk of the €648 billion earmarked by the EU to speed recovery from the Covid pandemic and its aftermath. According to the European Commission, Poland will be the largest recipient under the €2 trillion budget being proposed for 2028-34, with additional funds to be made available for security, agriculture, and innovation.
“Poland will most likely remain a champion in both absorbing and distributing EU funds into the real economy,” says Trajkovic, “which are expected to account for 1% of GDP this year and 3% next. Along with domestic consumption and investment, they will be one of the main drivers of the economy.”
The good news continues with FDI and Greenfield investments. According to the 2025 EY Europe Attractiveness survey, while FDI within the entirety of Europe dropped some 5% over 2024 and inflows to Poland retreated from 2023’s record of $28 billion, Polish industries including new technologies, renewable energy, services, and logistics continue to see strong investor interest. Reinvested profits are on an upward trend.
The EBRD Commits
Despite some political turmoil, the country has changed dramatically in the past five years, says Andreea Moraru, the European Bank for Reconstruction and Development’s (EBRD) new director for Poland and the Baltic States. “Compared to 2019, when I was last here, Warsaw is utterly transformed,” she notes. “Real estate is booming, as is construction, and companies are much more ambitious, with many now looking abroad to expand.”
Andreea Moraru, Director for Poland and the Baltic States, EBRD
Poland’s economy today is sophisticated, innovative, and cutting edge, she says: “Companies are moving away from simple manufacturing to more value-added production. However, to stay competitive, Poland will need to continue investing in its human capital.”
The EBRD invested a record €1.43 billion in 49 projects in 2024; so far this year, it has invested another €900 million, an amount that is expected to rise, reflecting the bank’s countercyclical investment approach
“Whenever there’s a funding gap, as during market volatility, we move to fill it,” says Moraru.
The EBRD’s broad investment portfolio reflects Poland’s increasing economic diversity, with a major presence in the EBRD’s portfolio—often alongside the country’s liquid and dynamic commercial banks—in the corporate sector, pharma, manufacturing, and telecoms.
Perhaps its most consistent focus, however, is energy. Some 70% of the EBRD’s 2024 investments went to support decarbonization through renewable projects and other clean-energy initiatives in an economy that is still heavily coal dependent for electricity. Projects include Poland’s first offshore wind farm, to which the bank committed €140 million and which is expected to provide some 3% of Poland’s electric power, and the innovative Bioelektra municipal waste processing plant in Wierzbica, to which the bank has committed €17 million. Green bonds are an additional focus. Between 2023 and 2025, the EBRD has invested in five such offerings by Polish banking clients alongside one sustainability bond.
Six Pillars to Prosperity
In a speech before the Warsaw Stock Exchange before the presidential election, Tusk insisted that 2025 would be a “long-awaited year of the positive,” suggesting that investments in FDI and Greenfield will exceed PLN650 billion ($175 billion), perhaps reaching as high as PLN700 billion ($189 billion), fueled by EU funds from grants and loans. Saying he wanted a “strong, modern, and prosperous Poland,” he identified six pillars to achieving this: investment in science, energy transformation, development of new technologies, development of ports and railway modernization, a dynamic capital market, and business support and deregulation.
Key changes in government, announced after Tusk won a parliamentary confidence vote following the presidential elections, reflect his priorities. Establishment of a new energy ministry was announced a few weeks after Poland ended all purchases of Russian fossil fuels, which in 2015 still accounted for 84% of energy consumption. Tusk has confirmed that Poland is pressing ahead with a wave of new renewables projects and that first-phase ground studies have been completed for Poland’s first nuclear power station, with Bechtel and Westinghouse leading the construction and commissioning of the first unit scheduled for 2033.
Among the challenges Finance Minister Domański faces are bringing Poland’s fiscal deficit under control and stabilizing government debt in the medium term. From 2021 to 2024, the budget deficit rose from 1.7% to 6.6% of GDP, fueled by expenditures on pensions, infrastructure, and defense. Relative to GDP, Poland already spends more on its military than any other NATO country: 2% in 2021 against a rise to 5% in the medium term.
In addition, a large portion of future defense spending is slated to be done off-budget and financed through off-budget issuance, a practice that started during Covid and is expected to reach some 13% of GDP by 2028. The practice is accounted for in general government debt, helping to maintain fiscal transparency.
With the government targeting a general government deficit of 6.3% of GDP this year in its most recent progress report, reducing the shortfall is viewed as necessary if Poland is to maintain long-term economic credibility in the eyes of foreign investments and lenders and control rising debt service costs. But the going could be tough.
“The biggest challenge is having to implement fiscal consolidation in an environment not conducive to it, with global growth slowing, a continuing risk of tariffs, and high geopolitical and security risks,” Trajkovic observes.
Another challenge is the business environment. In Transparency International’s 2025 Corruption Perceptions Index, Poland dropped to 53 out of 180 countries, alongside Georgia, compared to 2016, when it ranked better at 29. The current government blames the slide on the previous Law and Justice government, which weakened judicial independence, transparency in government contracts, and judicial independence. Tusk has promised reforms, but warns this will take time, especially with President Nawrocki holding veto power.
For the moment, however, the data are looking up. “On the positive side, by almost any metric, including FDI inflows, inflation, and overall growth prospects, Poland’s diversified, resilient economy is in good shape,” Trajkovic argues.