money

Here’s the Net Worth That Puts You in the Top 10% of American Households by Age

If you want to be among the top 10% of American households, you’ll need a seven-figure net worth.

Net worth is one of the most important financial numbers to know.

You should monitor your net worth because it changes over time, and it gives you a good idea of how close you are to being financially independent and shows whether you are making progress on your financial goals.

It can also be fun to see how your net worth stacks up to your peers. In particular, you may be curious about what net worth you would need to be among the top 10% of American households. The number is, unsurprisingly, pretty big.

Here’s the amount you would need, along with some details on calculating your net worth — and increasing it.

Adult looking at financial paperwork.

Image source: Getty Images.

How do you calculate your net worth?

Before diving into the net worth you need to be among the top 10%, it’s helpful to consider how to calculate net worth in the first place.

Net worth is essentially how much wealth you have to your name. To calculate your net worth:

  • Start by adding up the value of all your assets. Money in your bank account and savings account counts. So does money in your money market account. If you have CDs, these count as well. Same with investment dollars in a brokerage account. If you own real estate, a car, jewelry, personal items, or anything else of value, it counts toward your net worth.
  • Add up all your debt. You’ll also need to add up what you owe. Credit card debts, student loans, payday loans, a mortgage, and any other financial obligations you have will all become part of your debt calculation. You can check your credit report to confirm balances on all your debts if you aren’t sure of the amounts.
  • Subtract the amount of your debt from the value of your assets. If your assets are worth $500,000, for example, but you have $350,000 in debt, then you subtract $350,000 from $500,000 to discover that your net worth is $150,000.

If your net worth is negative, that’s pretty common if you’re young. Many people don’t own much, and they borrow for school, so they graduate with a lot of debt.

As you get older, though, your net worth should be growing as you build up money in brokerage accounts and retirement plans.

Are you in the top 10% of American households?

Now that you know how net worth is calculated, you may want to see where you stand.

The best information on this comes from the Federal Reserve’s Survey of Consumer Finances, which comes out once every three years. Unfortunately, the most recent data is from 2022. Still, we can take a look at that information to get an idea of what the top 10% of earners have in terms of wealth.

Based on this data from the Federal Reserve, the top 10% of American households had a net worth of at least $1,936,900, although the threshold varies by age. For example:

  • Among 18 to 29-year-olds, you’d need $281,550 or higher to be in the top 10%
  • Between 30 to 39, you’d need $711,400
  • Between 40 to 49, you’d need $1,313,700
  • Between 50 to 59, you’d need $2,629,060
  • Between 60 to 69, you’d need $3,007,400
  • At age 70 and over, you’d need $2,862,000

While these are high numbers, the amount is most likely even higher today due to the stellar performance of the stock market and the increase in real estate values in recent years.

While the Federal Reserve should have new data soon, these numbers show that it takes millions to be among the wealthiest Americans in terms of net worth.

Still, regardless of how you compare to your peers, what’s important is that you work on growing your own net worth by paying down debt, investing in your 401(k), IRA, and other accounts, and making smart financial choices that make you more financially secure over time.

Source link

If I Could Only Buy and Hold a Single Stock, This Would Be It

Alphabet is the one stock I’d own if I could only own one.

If I could only own one stock for the next decade, it would be Alphabet (GOOGL -2.05%) (GOOG -1.99%). The company has dispelled fears that artificial intelligence (AI) is a threat, while its biggest risk around its antitrust case is now behind it. Meanwhile, it probably has one of the best long-term growth setups of any stock out there.

Alphabet’s dominance starts with search. Google remains the front door to the internet for billions of people, and that’s not changing anytime soon due to the huge distribution advantage the company has. It controls both the world’s leading smartphone operating system and web browser in Android and Chrome, respectively, while its search revenue-sharing deal with Apple makes it the default search engine for Safari.

Artist rendering of a bull market.

Image source: Getty Images.

Meanwhile, Alphabet is now incorporating AI throughout Google to make its offering even stronger and help drive query growth. With new features like Lens and Circle to Search, Alphabet has found new ways to help people search instead of just typing in text. This is driving more queries, many of which have a shopping intent that feeds into its massive ad network. Meanwhile, AI Overviews and its new AI Mode, which lets users toggle between traditional results and chatbot-style answers, are also driving more engagement.

Google’s data advantage also shouldn’t be underestimated. The company has decades of user data, as well as videos through YouTube, that it can use to make its Gemini AI models better. Alphabet’s strength in multimodal AI is another area of strength that gets overlooked. The Gemini chatbot app has been taking off, largely due to Nano Banana, its newest AI image editor and creator, while Google Veo 3 is a video AI leader.

Alphabet has also spent decades creating one of the most wide-reaching ad networks on the planet. It can handle anything from global campaigns to local merchants. Creating great search and AI products is just half the battle; you need to be able to monetize them, and Alphabet’s unmatched ad network puts it light-years ahead of any emerging competition.

To the clouds and beyond

While search is Alphabet’s biggest business, it is far from a one-horse pony. Cloud computing has become the company’s fastest-growing business. Last quarter, Google Cloud revenue jumped 32% to $13.6 billion, while operating income more than doubled to $2.8 billion. Demand is so strong that Alphabet raised its 2025 capital expenditure (capex) budget by $10 billion to $85 billion to expand data center capacity. Unlike many peers, Google Cloud is vertically integrated from top to bottom. Google is the only company with its own world-class AI model and its own custom chips, called Tensor Processing Units (TPUs), that it’s using at scale. Those TPUs provide both cost and performance advantages, especially as workloads shift toward inference rather than training.

Alphabet is also taking AI deeper into the enterprise with its new Gemini Enterprise and Gemini Business subscriptions. These offerings let companies build and deploy AI agents without writing code. The launch includes pre-built agents and access to partner-built ones, all backed by enterprise-grade security features like Model Armor. This positions Google to compete directly with Microsoft and OpenAI for corporate AI spending, and early adopters such as Gap and Virgin Voyages are already reporting measurable productivity gains.

Behind all this, Google Cloud benefits from technology that’s hard to replicate. It developed Kubernetes, which is now the standard for containerized apps, and it owns one of the largest private fiber networks in the world, delivering low-latency performance on a global scale. Its pending acquisition of Wiz, meanwhile, will add a best-in-class cloud security platform. Google Cloud may be the third-largest cloud provider by market share, but its technology stack and integration with Gemini give it a differentiated position that could drive outsize growth over the next decade.

In addition to cloud computing, Alphabet also has some promising emerging bets. The one furthest along is Alphabet’s robotaxi unit Waymo, which is already operating in multiple U.S. cities and expanding rapidly. If it can lower costs, it could eventually become a huge profit driver for the company. The company’s quantum computing team, meanwhile, is also making real progress with its Willow chip, which has shown reduced error rates as it scales.

A cheap stock with big growth ahead

Despite all this, Alphabet’s valuation still looks attractive. The stock trades at a forward price-to-earnings (P/E) ratio of roughly 22.5 times projected 2026 earnings, which is a clear discount to its mega-cap AI peers. So, despite the rally in the stock this year, it still is not fully getting the respect it deserves.

Given its valuation, wide moat, growth prospects, and the optionality of its emerging bets in robotaxis and quantum computing, Alphabet is the one stock I’d own if I could only own one stock.

Source link

Prediction: These Relentless ETFs Will Beat the S&P 500 Again in 2026

The Vanguard Growth ETF and the Invesco QQQ Trust have been outpacing the S&P 500 for years.

Megacap technology stocks have been leading the market higher, and the odds of that happening again next year are high. As such, the Vanguard Growth ETF (VUG -3.28%) and the Invesco QQQ Trust (QQQ -3.47%) are both well positioned to once again outperform the S&P 500 in 2026.

Despite a few pauses along the way, this market has been powered by growth stocks, especially those tied to artificial intelligence (AI). Nvidia (NASDAQ: NVDA) has been one of the biggest winners, as it’s grown to become the largest company in the world with its graphics processing units (GPUs) powering the AI infrastructure boom. Meanwhile, cloud computing leaders, such as Microsoft (NASDAQ: MSFT), Amazon, and Alphabet, have all benefited from insatiable growth coming from AI demand.

They are all cash-rich, entrenched companies that have built scale and network effects that competitors will struggle to catch. They’re also the heaviest-weighted stocks in the market-cap-weighted growth exchange-traded funds (ETFs), which is why the Vanguard Growth ETF and Invesco QQQ Trust have done so well when tech has been in the driver’s seat. Both are built to let their winners run, and both have consistently delivered better returns than the S&P 500 over the past decade.

Even at record highs, I wouldn’t sit on the sidelines waiting for a correction. If you try to time a pullback, you risk missing the gains these leaders keep generating. Dollar-cost averaging into these ETFs remains one of the smartest ways to play this trend and stay invested without worrying about short-term swings.

Let’s take a closer look at why these ETFs are poised to once again outperform in 2026.

Vanguard Growth ETF

An investment in the Vanguard Growth ETF is a simple bet that large-cap growth stocks will continue to outperform value stocks. The ETF tracks the performance of the CRSP US Large Cap Growth Index, which is essentially the growth side of the S&P 500.

Its top 10 holdings are very similar to the S&P 500, but you’re getting these stocks in a much higher concentration, since it doesn’t hold any value stocks. The fund’s top 10 holdings make up more than 60% of its portfolio, compared with less than 40% for the S&P 500 itself. Meanwhile, over 60% of its holdings are in tech stocks, while a third of the S&P is made up of technology names.

That concentration is exactly why it tends to outperform when tech and growth stocks lead the market. It has been outpacing the broader index for years. Over the past decade, it’s generated an average annual return of 18% compared to 15.3% for the S&P 500. While that may not sound like a lot, with a $10,000 investment, that would be the difference between an ending balance of around $52,300 versus $41,500 for an ETF that tracks the S&P 500.

A stock screen with data and the letters ETF.

Image source: Getty Images.

Invesco QQQ Trust

Another ETF that looks well positioned to outperform the S&P 500 again in 2026 is the Invesco QQQ Trust. It tracks the Nasdaq-100, which focuses on the largest non-financial names on the Nasdaq exchange. The result is a tech-heavy growth fund where more than 60% of its assets sit in technology and much of the rest is in other growth areas.

Just like the S&P 500, the Nasdaq-100 is a market-cap-weighted index that is designed to let its winners run. So, when stocks like Nvidia and Microsoft soar, they naturally become a larger part of the ETF without any manager stepping in to rebalance. That means the fund rewards its winners and automatically reduces exposure to companies that fall behind.

The Invesco QQQ Trust’s track record is outstanding. Over the past 10 years, it’s returned around 20.3% annually, and a $10,000 investment over that period would be worth around $63,600. Even more impressively, the ETF has topped the S&P 500 more than 87% of the time on a 12-month rolling basis over this period.

As such, it’s not too bold of prediction that it will once again outperform next year.

Source link

Social Security Benefits Could Rise 2.7% in 2026. Here’s Why You May Not Get to Keep That Raise in Full.

Don’t start counting your extra money just yet.

In just a few days, the Social Security Administration (SSA) will be making a huge announcement about changes to the program in 2026. A new earnings-test limit will be shared, as well as the maximum monthly benefit.

Perhaps the most anticipated update the SSA will share, however, is an official cost-of-living adjustment, or COLA, for 2026.

Social Security cards.

Image source: Getty Images.

Each year, Social Security benefits are eligible for a raise, based on inflation. Without COLAs, beneficiaries would be pretty much guaranteed to lose buying power over time.

Initial projections are calling for a 2.7% COLA for 2026, but that number doesn’t take inflation data from September into account. If inflation rose substantially last month, seniors could be looking at an even larger boost to their Social Security checks in 2026.

While a 2.7% or higher COLA might seem like something to celebrate, you may want to temper your excitement if you count on Social Security for income. That’s because that COLA may not be yours to keep in full.

Will a Medicare increase eat into your COLA?

Seniors who are enrolled in Medicare and Social Security at the same time pay their premiums for Part B, which covers outpatient care, directly out of their monthly benefits. This means that if the cost of Medicare increases in 2026, it will eat into whatever COLA retirees receive.

In 2025, the standard monthly Part B premium rose from $174.70 to $185. But based on projections from the Medicare Trustees released earlier this year, the standard Part B premium for 2026 could be a whopping $206.50 — an increase of $21.50. It also could cause many seniors to lose out on a good chunk of their Social Security raises.

As of August, the average monthly Social Security benefit for retired workers was about $2,008. A 2.7% COLA would result in a boost of about $54 per month. However, if Medicare Part B goes up by $21.50 per month, the typical Social Security benefit might only rise by around $32.50, in practice.

It’s best to have income outside of Social Security

Until the SSA makes an official COLA announcement on Oct. 15, we won’t know for sure what next year’s COLA will amount to. However, even if it’s fairly generous, a large uptick in Part B costs could wipe out much of it.

That’s why it’s important not to be too reliant on Social Security COLAs to keep up with inflation. A better bet? Save well for retirement, and set yourself up with a portfolio of assets that continues to generate income for you.

Those assets could include a mix of stocks and bonds. The stocks should ideally provide growth and income in the form of dividend payments. The bond portion, meanwhile, may be more stable, providing you with steady income you can use to supplement your monthly Social Security checks.

There are other options for generating retirement income, too, like working part-time. And that part-time work doesn’t have to come in the form of a boring job with a strict, preset schedule.

Thanks to the gig economy, you can explore different options for earning some money. You may find that, on top of the extra income being helpful, it’s nice to have a reason to get out of the house on a regular basis and socialize with other people.

No matter what strategy you choose, the key is to have some income outside of Social Security — because while the program’s COLAs do help seniors keep up with inflation to some degree, they also have their fair share of shortcomings.

Source link

Social Security’s 2026 Cost-of-Living Adjustment (COLA) Is Set to Give Retirees the Short End of the Stick, Yet Again

A Social Security dollar simply isn’t what it used to be.

For most retirees, Social Security is more than just a monthly deposit into their bank accounts. It represents a financial lifeline that helps them make ends meet.

In 2023, Social Security lifted more than 22 million people out of poverty, according to an analysis from the Center on Budget and Policy Priorities (CBPP), and 16.3 million of these recipients were aged 65 and over. If Social Security didn’t exist, the CBPP estimates the poverty rate for adults aged 65 and up would jump nearly fourfold, from 10.1% (with existing payouts) to 37.3%.

Meanwhile, 24 years of annual surveys from Gallup show that 80% to 90% of aged beneficiaries lean on their payouts in some capacity to cover their expenses.

For retirees, few announcements have more bearing than the annual cost-of-living adjustment (COLA) reveal in October. Though Social Security payouts are on track to do something that hasn’t been witnessed in almost 30 years, next year’s “raise” appears set to give retirees the short end of the stick, yet again!

A seated person counting a fanned assortment of cash bills held in their hands.

Image source: Getty Images.

What is Social Security’s COLA and why might the 2026 reveal be delayed?

The fabled “COLA” you’ve probably been hearing and reading about over the last couple of weeks is the tool the Social Security Administration (SSA) has on its proverbial toolbelt to keep benefits aligned with inflation.

Hypothetically, if a large basket of goods and services that retirees regularly purchase increases in cost by 2% from one year to the next, Social Security benefits would also need to climb by 2%. Otherwise, these folks would see their buying power decline. Social Security’s COLA attempts to mirror the inflationary pressures that program recipients are facing so they don’t lose purchasing power.

This near-annual raise is based on changes to the Consumer Price Index for Urban Wage Earners and Clerical Workers (CPI-W), which has measured price changes for Social Security since 1975. It has more than 200 individually weighted categories, which allows the CPI-W to be chiseled down to a single figure at the end of each month. These readings can be compared to the prior-year period to determine if prices are collectively rising (inflation) or declining (deflation).

What makes the COLA calculation unique is that only CPI-W readings from July, August, and September (the third quarter) are used to determine the upcoming year’s raise. If the average third-quarter CPI-W reading in the current year is higher than the comparable period last year, prices, as a whole, have risen, and so will Social Security checks in the upcoming year.

The catch with Social Security’s 2026 COLA is that its expected reveal on Oct. 15 may be delayed. The September inflation report is the final puzzle piece needed to calculate the program’s cost-of-living adjustment. However, most economic data releases are delayed during a federal government shutdown, which, in turn, can postpone the Oct. 15 COLA announcement set for 8:30 a.m. ET.

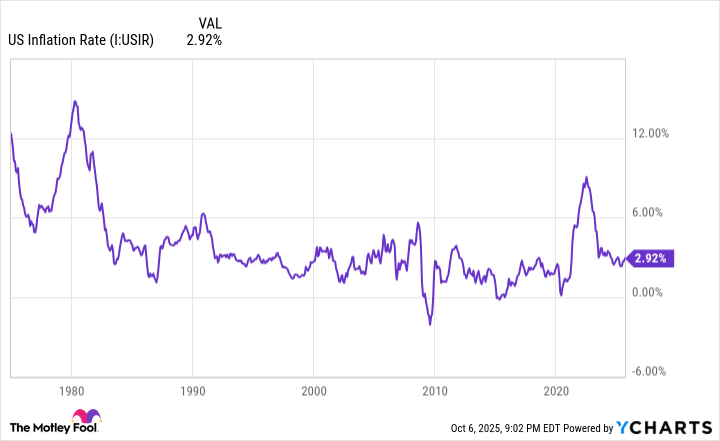
US Inflation Rate Chart

A higher prevailing rate of inflation in recent years has led to beefier annual COLAs. U.S. Inflation Rate data by YCharts.

A first-of-its-century raise is eventually headed retirees’ way

Once the SSA does have the necessary data to calculate and reveal the 2026 COLA, it’s a virtual certainty that beneficiaries will witness history being made.

Over the last four years, Social Security recipients — retired workers, workers with disabilities, and survivor beneficiaries — have enjoyed above-average cost-of-living adjustments. From 2022 through 2025, their Social Security checks grew by 5.9%, 8.7%, 3.2%, and 2.5%, respectively. To put these figures into some sort of context, the average COLA increase over the last 16 years was 2.3%.

Based on two independent estimates that were updated following the release of the August inflation report, a fifth-consecutive year above this 16-year average is expected.

Nonpartisan senior advocacy association The Senior Citizens League (TSCL) has pegged their 2026 COLA forecast at 2.7%, while independent Social Security and Medicare policy analyst Mary Johnson is calling for a slightly higher boost of 2.8%. These two forecasts would imply a roughly $54 to $56 per-month increase in the average retired-worker benefit in the new year.

More importantly, a 2.7% or 2.8% COLA would result in an event that hasn’t been witnessed in almost three decades. From 1988 through 1997, Social Security COLAs vacillated between 2.6% and 5.4%. If the 2026 COLA comes in at 2.5% or above, which looks like a virtual certainty based on independent estimates, it would mark the first time in 29 years that benefits will have risen by at least 2.5% for five consecutive years.

A Social Security card wedged between a fanned assortment of cash bills.

Image source: Getty Images.

The purchasing power of a Social Security dollar isn’t what it used to be

Unfortunately, this potentially history-making moment won’t be fully felt or enjoyed by aged beneficiaries. Though nominal payouts have notably climbed in recent years, the painful reality is that the buying power of Social Security income simply isn’t what it once was.

For example, you might be surprised to learn that the CPI-W isn’t doing retirees any favors. While this index is designed to mirror the inflationary pressures that Social Security’s retired workers are contending with, it has built-in flaws that keep this from happening.

The CPI-W is an index that tracks the cost pressures faced by “urban wage earners and clerical workers,” who, in many cases, are workers under the age of 62. By comparison, 87% of Social Security beneficiaries are 62 and above, as of December 2024.

Aged beneficiaries spend their money differently than workers under the age of 62. Specifically, retirees spend a higher percentage of their budget on medical care services and shelter than younger folks. Even though seniors make up 87% of all Social Security recipients, the CPI-W doesn’t account for the added importance of shelter and medical-care service costs in the COLA calculation.

Furthermore, the trailing-12-month inflation rate for shelter and medical care services has pretty consistently been higher than the annual COLAs beneficiaries have received. According to TSCL, this disparity has played a role in reducing the buying power of Social Security income by 20% from 2010 to 2024. A 2.7% or 2.8% cost-of-living adjustment isn’t going to offset or halt this decline in purchasing power.

To make matters worse, dual enrollees — those receiving Social Security income who are also enrolled in traditional Medicare — are expected to see sizable COLA offsets due to a projected double-digit percentage increase in the Part B premium in 2026.

Part B is the portion of Medicare responsible for outpatient services, and the premium for Part B is commonly deducted from a Social Security recipient’s monthly benefit. An estimate from the 2025 Medicare Trustees Report calls for an 11.5% jump in the Part B premium to $206.20 next year. For lifetime low earners, this increase might gobble up every cent of their projected 2026 COLA.

Regardless of whether or not Social Security’s 2026 COLA is delayed, it’ll mark another year where retirees get the short end of the stick.

Source link

Trust Co Goes Big on Bonds With $15 Million BND Buy

Trust Co disclosed the purchase of 209,679 additional shares of Vanguard Bond Index Funds – Vanguard Total Bond Market ETF, estimated at $15.44 million (rounded from $15,439,353), in its SEC filing for the period ended September 30, 2025, submitted on October 6, 2025.

What happened

According to a filing with the Securities and Exchange Commission dated October 06, 2025, Trust Co increased its stake in Vanguard Bond Index Funds – Vanguard Total Bond Market ETF(BND 0.40%) by 209,679 shares during the quarter. The estimated value of shares acquired is $15.44 million, based on the average price for the period.

What else to know

The fund added to its BND position, which now represents 7.0660% of reportable assets under management.

Top holdings following the filing:

  • SHV: $84,464,498 (8.6% of AUM)
  • BND: $69.08 million (7.1% of AUM)
  • AGG: $66.39 million (6.8% of AUM)
  • VUG: $62,950,365 (6.4% of AUM)
  • VTV: $59,005,900 (6.0% of AUM)

BND’s trailing twelve-month dividend yield was 3.79% as of October 6, 2025.

Company overview

Metric Value
AUM N/A
Dividend Yield 3.79%
Price (as of market close October 3, 2025) $74.31
1-Year Price Change (0.44%)

Company snapshot

Vanguard Total Bond Market ETF (BND) tracks the performance of the broad U.S. investment-grade taxable bond market through a passively managed, index-sampling strategy.

Its portfolio includes U.S. government, corporate, mortgage-backed, and asset-backed securities with maturities over one year, providing diversified fixed income exposure.

The fund serves institutional and retail investors seeking broad, low-cost exposure to the U.S. bond market.

Vanguard Total Bond Market ETF (BND) is one of the largest fixed income ETFs, offering investors comprehensive access to the U.S. investment-grade bond universe.

Foolish take

Trust Co added $15.4 million worth of Vanguard Bond Index Funds – Vanguard Total Bond Market ETF. This addition increased it position to roughly 7% of total AUM, showing meaningful exposure.

As one of the largest bond ETFS, BND gives investors a one-stop exposure to the U.S bond market, spanning Treasuries, corporate bonds and mortgage backed securities. It is often used as a foundation for income-oriented portfolios that value stability and diversification.

The renewed demand for broad funds like BND reflects a shift from several years of stock-heavy market leadership. With interest rates still elevated, investors are finding value in locking in higher bond yields while they last. That makes funds like BND appealing again to both institutional and individual investors looking for steady returns.

For long term investors, adding BND can steady a portfolio while still collecting a reliable income stream. Its stability and diversification make it a solid foundation for any balanced portfolio.

Glossary

13F reportable assets:Assets that institutional investment managers must disclose quarterly to the SEC if they exceed $100 million.

AUM (Assets Under Management):The total market value of assets an investment manager handles on behalf of clients.

ETF (Exchange-Traded Fund):A fund that trades on stock exchanges and holds a diversified portfolio of securities.

Dividend yield:Annual dividends paid by an investment, expressed as a percentage of its current price.

Trailing twelve-month (TTM) dividend yield:Dividend yield calculated using dividends paid over the last twelve months.

Index-sampling strategy:A method where a fund holds a representative sample of securities from an index, not every component.

Investment-grade:Bonds rated as relatively low risk of default by credit rating agencies.

Fixed income:Investment securities that pay regular interest, such as bonds, providing predictable income streams.

Mortgage-backed securities:Bonds secured by a pool of mortgages, with payments passed through to investors.

Asset-backed securities:Bonds backed by pools of assets like loans, leases, or receivables, rather than mortgages.

Passively managed:An investment approach aiming to replicate the performance of a market index, with minimal trading.

Stake:The total ownership or holding an investor has in a particular security or fund.

Source link

Financial Management Company Douglas Lane Raised Its Thermo Fisher Stake. Is the Stock a Buy?

On October 10, 2025, wealth management company Douglas Lane & Associates disclosed a purchase of Thermo Fisher Scientific valued at approximately $7.79 million, based on the average price for Q3 2025.

What happened

According to a filing with the Securities and Exchange Commission (SEC) dated October 10, 2025, Douglas Lane & Associates increased its position in Thermo Fisher Scientific (TMO -1.85%) by 16,745 shares during the quarter. The estimated transaction value was $7.79 million, based on the average closing price for the quarter. The fund now holds 216,276 shares after the trade.

What else to know

Following the purchase, Thermo Fisher Scientific represented 1.5% of the fund’s reportable assets under management as of September 30, 2025.

Top holdings after the filing are as follows:

  • NASDAQ:NVDA: $312.46 million (4.4% of AUM) as of September 30, 2025
  • NASDAQ:GOOG: $212.16 million (3.0% of AUM) as of September 30, 2025
  • NYSE:JPM: $203.56 million (2.8% of AUM) as of September 30, 2025
  • NASDAQ:MSFT: $184.79 million (2.6% of AUM) as of September 30, 2025
  • NASDAQ:QCOM: $167.31 million (2.3% of AUM) as of September 30, 2025

As of October 9, 2025, Thermo Fisher shares were priced at $534.68, and were down about 12% over the trailing 12 months.

Company Overview

Metric Value
Revenue (TTM) $43.21 billion
Net Income (TTM) $6.58 billion
Dividend Yield 0.32%
Price (as of market close 2025-10-09) $534.68

Company Snapshot

Thermo Fisher Scientific offers life sciences solutions, analytical instruments, specialty diagnostics, laboratory products, and biopharma services with revenue streams diversified across research, diagnostics, and pharmaceutical sectors.

The company operates a multi-segment business model, generating revenue through direct sales, e-commerce, and third-party distribution of proprietary products, consumables, and services. It serves pharmaceutical and biotechnology companies, clinical and research laboratories, academic institutions, government agencies, and industrial customers globally.

A scientist takes notes while working in a laboratory.

IMAGE SOURCE: GETTY IMAGES.

Thermo Fisher Scientific is a global leader in scientific instrumentation, diagnostics, and laboratory services, with a broad portfolio that supports research, healthcare, and biopharmaceutical production. The company leverages scale and a diverse product offering to drive consistent revenue growth, and serve a wide range of end markets.

Foolish take

Douglas Lane upping its Thermo Fisher Scientific holdings is noteworthy in that the wealth management company already had a substantial stake. This move suggests Douglas Lane believes Thermo Fisher stock remains attractively valued, especially after its decline over the last 12 months.

Indeed, looking at Thermo Fisher stock’s price-to-earnings (P/E) ratio shows it’s lower than it was a year ago. This indicates shares are a better value now, although the earnings multiple is not as low as it was after President Trump’s new tariff policies caused the entire stock market to fall last April.

As far as its business performance, Thermo Fisher is doing well. It achieved 3% revenue growth to $10.9 billion in its fiscal second quarter, ended June 28. The company did an outstanding job managing its expenses, and combined with its sales growth, allowed Thermo Fisher to deliver a 6% year-over-year increase in fiscal Q2 diluted earnings per share (EPS) to $4.28. This continues the trend of rising EPS exhibited over the last couple of years.

On top of that, Thermo Fisher raised its 2025 fiscal guidance to sales of about $44 billion. This would be a jump up from the prior year’s $42.9 billion. With rising revenue and EPS combined with a reasonable P/E ratio, Thermo Fisher stock looks like a compelling buy.

Glossary

Assets Under Management (AUM): The total market value of investments managed by a fund or investment firm.
13F Reportable Assets: Securities that institutional investment managers must disclose in quarterly SEC filings if they exceed $100 million in assets.
Alpha: A measure of an investment’s performance relative to a benchmark index, often indicating excess return.
Quarter: A three-month period used by companies for financial reporting and performance measurement.
Proprietary Products: Goods or services owned and produced exclusively by a company, often protected by patents or trademarks.
Consumables: Products intended for single or limited use, requiring regular replacement in laboratory or industrial settings.
Direct Sales: Selling products or services directly to customers without intermediaries or third-party distributors.
Third-Party Distribution: The sale of products through external companies or intermediaries rather than directly from the manufacturer.
Dividend Yield: The annual dividend payment expressed as a percentage of the stock’s current price.
Biopharma Services: Specialized services supporting the development and manufacturing of biopharmaceutical drugs.
End Markets: The final industries or customer segments that purchase and use a company’s products or services.
TTM: The 12-month period ending with the most recent quarterly report.

JPMorgan Chase is an advertising partner of Motley Fool Money. Robert Izquierdo has positions in Alphabet, JPMorgan Chase, Microsoft, Nvidia, and Qualcomm. The Motley Fool has positions in and recommends Alphabet, JPMorgan Chase, Microsoft, Nvidia, Qualcomm, and Thermo Fisher Scientific. The Motley Fool recommends the following options: long January 2026 $395 calls on Microsoft and short January 2026 $405 calls on Microsoft. The Motley Fool has a disclosure policy.

Source link

Sarasin Loads Up on Kimberly-Clark (KMB) With 964,000 Shares in Q3 2025

On October 10, 2025, Sarasin & Partners LLP disclosed a significant buy of Kimberly-Clark (NYSE: KMB), acquiring 963,978 shares in an estimated $119.87 million trade.

What happened

Sarasin & Partners LLP disclosed in its SEC filing dated October 10, 2025, that it increased its stake in Kimberly-Clark by 963,978 shares during the quarter. The estimated transaction value was $119.87 million, bringing the total holding to 2,048,544 shares worth $251.27 million as of September 30, 2025.

What else to know

The KMB position now represents 2.47% of Sarasin & Partners LLP’s 13F reportable AUM as of September 30, 2025.

Top five holdings after the filing include:

  • NASDAQ:MSFT: $1.02 billion (10.0% of AUM) as of September 30, 2025
  • NASDAQ:NVDA: $828.58 million (8.1% of AUM) as of September 30, 2025
  • NASDAQ:AMZN: $570.02 million (5.6% of AUM) as of September 30, 2025
  • NASDAQ:GOOGL: $556.62 million (5.5% of AUM) as of September 30, 2025
  • NASDAQ:META: $456.06 million (4.5% of AUM) as of September 30, 2025

As of October 9, 2025, shares were priced at $119.55, down 15.9% over the year ending that date and underperforming the S&P 500 by 29 percentage points over the same period.

Company Overview

Metric Value
Revenue (TTM) $18.88 billion
Net Income (TTM) $2.43 billion
Dividend Yield 4.22%
Price (as of market close 2025-10-09) $119.55

Company Snapshot

Kimberly-Clark manufactures and markets personal care products, consumer tissue, and professional hygiene solutions under brands such as Huggies, Kleenex, Scott, and Kotex.

The company generates revenue primarily through the sale of branded disposable consumer products and leveraging global distribution to supermarkets, mass merchandisers, and e-commerce channels.

Key customers include individual consumers, retail outlets, and commercial institutions in the household, healthcare, and professional sectors worldwide.

Kimberly-Clark is a leading global provider of personal care and tissue products, operating at scale with a diversified portfolio of well-established brands.

Foolish take

Kimberly-Clark has been lackluster in some ways, with its stock price down for the year and underperforming the S&P 500. This isn’t necessarily new for the company, either, as its price has remained fairly flat over the last several years.

Where this stock shines, though, is its dividend yield. Kimberly-Clark has increased its dividend every year for more than 50 years, making it a reliable choice for those looking for consistent passive income.

As a leader in the consumer staples space, the company has the advantage of consistent demand for its products no matter what the economy is doing. While its growth potential may be falling short, it’s still a reliable stock for many income investors and those who are more risk-averse.

Glossary

13F reportable AUM: Assets under management that must be disclosed in quarterly SEC Form 13F filings by institutional investment managers.
AUM (Assets Under Management): The total market value of investments managed on behalf of clients by a fund or firm.
Quarter ended: The final date of a three-month financial reporting period used for performance and regulatory purposes.
Stake: The amount of ownership or shares an investor or fund holds in a particular company.
Top five holdings: The five largest investments in a fund’s portfolio by market value.
Dividend yield: Annual dividends paid by a company divided by its share price, expressed as a percentage.
TTM: The 12-month period ending with the most recent quarterly report.
Mass merchandisers: Large retail stores that sell a wide variety of goods at lower prices, such as supermarkets or big-box retailers.
Branded disposable consumer products: Single-use items sold under recognized brand names for personal or household use.
Institutional investors: Organizations like pension funds, mutual funds, or endowments that invest large sums of money.

Katie Brockman has no position in any of the stocks mentioned. The Motley Fool has positions in and recommends Alphabet, Amazon, Meta Platforms, Microsoft, and Nvidia. The Motley Fool recommends the following options: long January 2026 $395 calls on Microsoft and short January 2026 $405 calls on Microsoft. The Motley Fool has a disclosure policy.

Source link

Financial Services Company Wealth Oklahoma Began Investing in Allison Transmission. Is the Stock a Buy?

The former Stolper Co is a financial management company that merged with another financial services business to form Wealth Oklahoma in 2025. It initiated a new position in Allison Transmission Holdings (ALSN -2.01%), acquiring 75,606 shares in the third quarter, an estimated $6.4 million trade based on the average price for Q3 2025, according to its October 10, 2025, SEC filing.

What happened

Wealth Oklahoma disclosed the purchase of 75,606 shares of Allison Transmission Holdings in its quarterly report filed with the U.S. Securities and Exchange Commission on October 10, 2025 (SEC filing). The new holding was valued at $6.4 million as of Q3 2025, with the transaction representing 1.9% of Stolper’s $330 million in reportable U.S. equity assets.

What else to know

This is a new position; the stake now accounts for 1.9% of Wealth Oklahoma’s 13F reportable assets as of September 30, 2025.

Top holdings after the filing are as follows:

  • BRK-B: $18.96 million (5.75% of AUM) as of 2025-09-30
  • JPM: $17.74 million (5.37% of AUM) as of 2025-09-30
  • AAPL: $14.90 million (4.52% of AUM) as of 2025-09-30
  • GOOGL: $11.92 million (3.6% of AUM) as of 2025-09-30
  • COF: $10.73 million (3.25% of AUM as of Q3 2025)

As of October 9, 2025, Allison Transmission shares were priced at $81.02, down 18.4% over the prior year ending October 9, 2025 and underperforming the S&P 500 by 33.9 percentage points over the past year.

The company reported trailing 12-month revenue of $3.2 billion for the period ended June 30, 2025 and net income of $762 million for the period ended June 30, 2025.

Allison Transmission’s dividend yield stood at 1.3% as of October 10, 2025. Shares were 35% below their 52-week high as of October 9, 2025.

Company Overview

Metric Value
Revenue (TTM) $3.20 billion
Net Income (TTM) $762.00 million
Dividend Yield 1.33%
Price (as of market close 10/09/25) $81.02

Company Snapshot

Allison Transmission designs and manufactures fully automatic transmissions and related parts for commercial, defense, and specialty vehicles. It also offers remanufactured transmissions and aftermarket support.

The company generates revenue primarily through product sales to original equipment manufacturers and aftermarket services, including replacement parts and extended coverage.

Allison Transmission serves a global customer base of OEMs, distributors, dealers, and government agencies, with a focus on commercial vehicle and defense markets.

A trucker sits in his big rig cab.

Image source: Getty Images.

Allison Transmission is a leading provider of fully automatic transmissions for medium- and heavy-duty commercial and defense vehicles worldwide. The company leverages a broad distribution network and long-standing OEM relationships to maintain a strong position in the auto parts sector.

Foolish take

Founded in 1915, Allison Transmission is a veteran of propulsion systems technology. It’s the world’s largest manufacturer of medium and heavy-duty fully automatic transmissions, according to the company.

Allison Transmission’s sales are down slightly year over year. Through the first half of 2025, revenue stood at $1.58 billion compared to $1.61 billion in 2024.

This lack of sales growth is a contributor to the company’s share price decline, adding to its dismal 2025 outlook, which it slashed due to softness in demand in some of its end markets, such as for medium-duty trucks. Allison Transmission now expects 2025 revenue to come in between $3.1 billion to $3.2 billion, down from $3.2 billion to $3.3 billion.

With Allison Transmission shares hovering around a 52-week low, Wealth Oklahoma took advantage to initiate a position in the stock. This speaks to Wealth Oklahoma’s belief that Allison Transmission can bounce back. This might be the case, given Allison’s recent acquisition of Dana Incorporated, which provides drivetrain and propulsion systems in over 25 countries.

With a price-to-earnings ratio of 9, Allison Transmission’s valuation looks attractive, which also explains Wealth Oklahoma’s purchase. The stock certainly looks like it’s in buy territory.

Glossary

13F reportable assets: U.S. equity holdings that institutional investment managers must disclose quarterly to the SEC on Form 13F.
AUM (Assets Under Management): The total market value of investments managed on behalf of clients by a financial institution or fund manager.
Dividend yield: Annual dividend payments divided by the share price, expressed as a percentage, showing income return on investment.
Trailing twelve months (TTM): The 12-month period ending with the most recent quarterly report.
Original equipment manufacturer (OEM): A company that produces parts or equipment that may be marketed by another manufacturer.
Aftermarket services: Products and support provided after the original sale, such as replacement parts, maintenance, or extended warranties.
Stake: The amount or percentage of ownership an investor or institution holds in a company.
Quarterly report: A financial statement filed every three months, detailing a company’s performance and financial position.
Distribution network: The system of intermediaries, such as dealers and distributors, through which a company sells its products.
Defense market: The sector focused on supplying products and services to military and government defense agencies.

JPMorgan Chase is an advertising partner of Motley Fool Money. Robert Izquierdo has positions in Alphabet, Apple, and JPMorgan Chase. The Motley Fool has positions in and recommends Alphabet, Apple, and JPMorgan Chase. The Motley Fool recommends Allison Transmission and Capital One Financial. The Motley Fool has a disclosure policy.

Source link

What Sent This High-Flying Ultra-Luxury Giant’s Stock 16% Lower Thursday?

This stock constantly trades at a premium valuation and leaves competitors in the dust with margins, but stumbled Thursday — is it a buying opportunity?

Welcome to the show! Ferrari (RACE -3.08%) gave investors a sneak peek at its upcoming first full-electric model last week, with an unveiling laser light show that might rival Las Vegas’ Sphere. Despite the light show and base-thumping heavy music, the unveiling failed to electrify investors as the stock promptly plunged nearly 16% on Thursday — its largest one-day drop since its IPO in 2015.

But not everything is as it seems. Let’s cover the details and ramifications of its upcoming full-electric EV supercar, as well as what really sent the stock tumbling.

Ferrari F80 car.

Image source: Ferarri.

Rock and a hard place

Ferrari finds itself in an interesting and challenging position, currently. On one hand, Ferrari due to its intangible assets, brand moat, pricing power, and loyal consumer base, could likely churn out a full-electric supercar that maintains its impressive ultra-luxury-like margins — unlike traditional automakers that are losing money on electric vehicles (EVs) hand over fist.

On the other hand, Ferrari’s competitors are pushing back their own full-electric supercars due to lack of demand. While Ferrari is preparing to unleash its Elettrica onto a road filled with uncertainty, its competitors are pulling back. Ferrari rival Lamborghini said it would delay the launch of its first full-electric model to 2029, instead of 2028, while Porsche cut back its plans for battery-electric vehicles (BEVs) due to soft sales of its full-electric Macan and Taycan. Stellantis subsidiary Maserati canceled plans for its BEV version of its MC20 sports car.

Ferrari zigging while its competitors zag is a significant bet on the near-term future of not only EVs, but the direction of its supercar lineup. Ferrari plans to invest a significant 4.7 billion euros between 2026 and 2030 for electrification and the supercar maker expects BEVs to account for one-fifth of its sales by the end of this decade. Unbeknownst to many investors is that Ferrari is already somewhat electrified as roughly half of its vehicle shipments are hybrids.

“Luxury EVs are still a young and immature category,” says Brian Lum, an investment manager at Baillie Gifford, according to Barron’s. “It’s important to build that next generation of Ferraristi, and electrification should help them to do that.”

It’s also worth noting that while Ferrari’s brand has seemingly had impenetrable armor over the past decades, part of that is driven by the company continually innovating and producing state-of-the-art combustion engine supercars. If Ferrari’s first full EV doesn’t live up to performance heritage, or its niche consumers don’t buy into the idea of EVs, and it flops commercially, it could be the first chink in that brand armor perhaps ever.

What’s the problem?

The driving force behind Ferrari’s rare share price plunge wasn’t vehicle centric. In fact, so far the Elettrica is very Ferrari-like, and we’ll get more details and design clues over time. With 1,000 horsepower, it offers power output that rivals its combustion engine supercars, and the same goes for its top speed of more than 192 miles per hour. After a single charge, its range checks the necessary box of over 300 miles by an extra 29 miles, helping reduce consumer range anxiety.

The problem was that Ferrari also unveiled its financial projections for the rest of this decade, and they checked in lower than analysts expected. While Ferrari slightly raised its out look for 2025, now expecting a profit of 8.80 euros per share on revenue of 7.1 billion euros, its long-term guidance of 2030 adjusted earnings of 11.50 euros per share on revenue of 9 billion euros fell short of the 9.9 billion euros in revenue analysts expected, per FactSet.

While Ferrari’s full-EV (partial) unveiling was entirely overshadowed by slight long-term weakness, investors would be very wise to follow how the Elettrica’s launch goes in late 2026 — because a lot of the future hinges on its EV lineup striking a similar chord with its core enthusiasts as its combustion engine supercars have.

Ferrari remains an absolute top stock pick by nearly any measure, with margins the automotive industry dreams of, competitive advantages that aren’t easily replicable, and a brand image that stands in an arena by itself. Its near 16% drop was just a brief and small buying opportunity, and investors should be optimistic about its future despite analysts being slightly disappointed.

Daniel Miller has no position in any of the stocks mentioned. The Motley Fool recommends Ferrari and Stellantis. The Motley Fool has a disclosure policy.

Source link

Investment Company Luminus Loaded Up on This Leading Industrials Stock. Is It a Buy?

Luminus Management disclosed the purchase of 87,120 shares of Kirby Corporation (KEX -2.17%), with an estimated transaction value of $8.8 million in an Oct. 3 SEC filing.

What happened

According to the Oct. 3 filing with the Securities and Exchange Commission, Luminus Management increased its stake in Kirby Corporation by over 87,000 shares during the third quarter of 2025. The estimated trade value is $8.75 million, based on the average closing price for the quarter. Following the transaction, the fund holds 116,956 shares valued at $9.8 million as of September 30, 2025.

What else to know

Luminus Management’s increase in its Kirby stake means that stock now comprises 8.8% of reported AUM as of September 30, 2025.

Top holdings after the filing are:

  • NYSE:CC: $27.96 million (25.1% of AUM) as of September 30, 2025
  • NYSE:OI: $26.53 million (23.8% of AUM) as of September 30, 2025
  • NYSE:SEE: $17.65 million (15.9% of AUM) as of September 30, 2025
  • NYSE:KEX: $9.76 million (8.8% of AUM) as of September 30, 2025
  • NYSE:KWR: $7.97 million (7.1603% of AUM) as of September 30, 2025

As of October 2, 2025, Kirby shares were priced at $83.71, down 31.8% over the past year, underperforming the S&P 500 by 49.3 percentage points over the past year.

Company Overview

Metric Value
Price (as of market close 2025-10-02) $83.71
Market Capitalization $4.63 billion
Revenue (TTM) $3.27 billion
Net Income (TTM) $303.05 million

Company Snapshot

Kirby Corporation is a leading U.S. marine shipping and services company with significant scale in tank barge transportation and industrial equipment distribution. Its integrated business model leverages a large fleet and technical expertise to support critical supply chains for energy and industrial customers. The company’s broad service offering and national footprint provide a competitive edge in reliability and operational reach.

A barge carrying cargo heads away from a port.

Image source: Getty Images.

Kirby provides marine transportation of bulk liquid products, including petrochemicals, black oil, refined petroleum products, and agricultural chemicals. It also offers after-market services, parts, and equipment for engines, power systems, and oilfield applications.

The company generates revenue through barge and towing operations across U.S. inland and coastal waterways, as well as through distribution, servicing, and manufacturing of specialized industrial and energy equipment.

Kirby serves industrial customers in the petrochemical, oil refining, and agricultural sectors, along with U.S. government entities.

Foolish take

Luminus Management is an investment company focused on the energy and chemical sectors. Its stake in the Kirby Corporation aligns with this focus, since Kirby is a leading provider of marine transportation for the energy and petrochemical industries.

Luminus added to its existing Kirby position in a big way. The investment company previously held less than 30,000 shares. Now, that number is north of 116,000, demonstrating a belief the stock is destined for upside after Kirby shares dropped over 30% in the trailing 12 months. The stock hovers around a 52-week low as of Oct. 10.

The share price decline is understandable. Through the first half of 2025, Kirby’s sales of $1.6 billion were flat compared to 2024. Harsh winter weather conditions during the first quarter, and an uncertain macroeconomic environment on the trade policy front, cut into demand for the company’s services, resulting in lackluster sales.

However, Kirby management expects to end 2025 with a 15% to 25% year-over-year increase in earnings. Its net earnings through two quarters are up around 10%. If it misses this earnings goal, Kirby shares could sink further than it already has this year. So while the share price decline looks like a buy opportunity given Kirby’s leadership in the marine transport space, investing in the stock holds some risk.

Glossary

13F reportable AUM: Assets under management that must be disclosed by institutional investment managers in quarterly SEC Form 13F filings.
AUM (Assets Under Management): The total market value of investments managed on behalf of clients by a fund or firm.
Quarterly average price: The average price of a security over a specific three-month period, often used to estimate transaction values.
Post-trade position: The total holdings of a security after the most recent buy or sell transaction is completed.
Filing: An official document submitted to a regulatory authority, such as the SEC, disclosing financial or operational information.
Tank barge transportation: The movement of bulk liquid cargo using specialized flat-bottomed vessels on inland or coastal waterways.
Distribution (in industrial context): The sale and delivery of products, parts, or equipment to customers or service providers.
After-market services: Support, maintenance, and parts provided for equipment after its initial sale.
Integrated business model: A strategy where a company controls multiple stages of its supply chain or service process.
National footprint: The presence and operational reach of a company across multiple regions or the entire country.
TTM: The 12-month period ending with the most recent quarterly report.

Source link

Big Money Move: NextEra Energy Soars to Fund’s Top Holding After $4 Million Buy, According to Recent Filing

Ausbil Investment Management Ltd disclosed a purchase of approximately $4.31 million in NextEra Energy (NEE -0.50%) shares, according to an SEC filing for the period ended September 30, 2025.

What Happened

According to a filing with the Securities and Exchange Commission dated October 08, 2025, Ausbil increased its position in NextEra Energy by 58,977 shares during the quarter. The fund held 140,270 shares, worth $11.04 million as of quarter-end.

What Else to Know

Fund bought shares, bringing its NextEra Energy stake to 5.9% of reportable AUM

Top holdings after the filing:

  • NEE: $11.04 million (5.9% of AUM) as of September 30, 2025
  • NSC: $10.08 million (5.4% of AUM) as of September 30, 2025
  • CSX: $10.06 million (5.4% of AUM) as of September 30, 2025
  • LNG: $7.71 million (4.1% of AUM) as of September 30, 2025
  • ES: $7.32 million (3.9% of AUM) as of September 30, 2025

As of October 8, 2025, shares were priced at $84.04, up 4.4% in the past year, underperforming the S&P 500 by 10.65 percentage points over the same period.

Company Overview

Metric Value
Revenue (TTM) $25.90 billion
Net Income (TTM) $5.92 billion
Dividend Yield 2.64%
Price (as of market close 10/08/25) $84.04

Company Snapshot

NextEra Energy generates, transmits, and distributes electric power through wind, solar, nuclear, coal, and natural gas facilities, with a growing portfolio in renewable energy and battery storage projects.

The company operates a regulated utility business and develops long-term contracted clean energy assets, earning revenue primarily from electricity sales and energy infrastructure services.

It serves about 11 million people through roughly 5.7 million customer accounts on the east and lower west coasts of Florida as of December 31, 2021.

NextEra Energy, Inc. is a leading North American utility and renewable energy provider with significant scale and a diversified generation portfolio. Its strategic focus on renewables and grid modernization positions it as a key player in the transition to sustainable energy.

Foolish Take

Ausbil Investment Management’s decision to acquire more than $4.3 million worth of NextEra Energy stock looks like a big bet on a stock that has underperformed the benchmark S&P 500 over the last year. Bear in mind, following this purchase, NextEra Energy is now Ausbil’s largest single position. The stock now represents nearly 6% of its total AUM, meaning the portfolio managers have strong conviction in NextEra’s potential.

Nevertheless, NextEra’s three-year performance isn’t anything to write home about. Shares have generated a three-year total return of only 18%, which equates to a compound annual growth rate (CAGR) of 5.8%. Meanwhile, the S&P 500 has generated a total return of 90% over that same period and a CAGR of 23.8%.

In other words, this is a notable buy, as it shows at least one large institutional money manager is making a significant bet on NextEra stock. Given the company’s key role within the North American utility industry and its focus on renewables and sustainable energy, investors who are seeking exposure to the utility sector may be well served by giving NextEra stock a closer look.

That said, NextEra’s chronic underperformance versus the S&P 500 should also be taken into account. No institutional move should ever be the sole reason for buying or selling a stock, and while this move is significant, NextEra stock still has much to prove.

Glossary

13F reportable AUM: Assets under management reported by institutional investment managers on SEC Form 13F, covering certain U.S. securities.
Dividend Yield: Annual dividends per share divided by the share price, expressed as a percentage.
Regulated utility: A utility company whose rates and operations are overseen by government agencies to protect consumers.
Long-term contracted clean energy assets: Renewable energy projects with multi-year agreements to sell electricity at set prices.
Grid modernization: Upgrading electric power infrastructure to improve reliability, efficiency, and support for renewable energy.
Battery storage projects: Facilities that store electricity for later use, helping balance supply and demand on the grid.
Stake: The ownership interest or shareholding an investor holds in a company.
Trailing the S&P 500: Underperforming the S&P 500 index over a specified period.
TTM: The 12-month period ending with the most recent quarterly report.
Quarter-end: The last day of a fiscal quarter, used for financial reporting and valuation.
Contracted revenue: Income guaranteed by signed agreements, often over multiple years.

Jake Lerch has positions in Norfolk Southern. The Motley Fool has positions in and recommends Cheniere Energy and NextEra Energy. The Motley Fool has a disclosure policy.

Source link

3 Brilliant but Overlooked Driverless Vehicle Stocks to Buy and Hold for 10 Years

If you’re looking for hidden gems that could return significant value as driverless vehicles take over roads, start here.

Like it or not, and whether we trust driverless vehicles yet or not, they’re on the way, and the future is coming faster than many investors realize. The driverless vehicle market has enormous growth potential and is projected to be worth trillions of dollars in a decade’s time.

Don’t take it from me: Goldman Sachs Research predicts that robotaxis’ ride-share market alone is on the path for a 90% compound annual growth rate between 2025 and 2030, and that’s merely scratching the surface. If you’re looking to dip your toes into what could be a generational investing opportunity, here are three stocks to keep an eye on.

One way to play robotaxis

Mobileye Global (MBLY -6.56%) is in the business of developing and deploying Advanced Driver Assistance Systems (ADAS) and autonomous driving technologies and solutions. With a comprehensive collection of software and hardware technologies, Mobileye can offer end-to-end products and services for automakers. Investors should look at Mobileye as a solid robotaxi investment for those who don’t want to deal with the drama currently surrounding Tesla.

With the automotive industry heading toward driverless vehicles, Mobileye’s technology and systems will bolster automotive safety, productivity, and vehicle utilization through solutions such as Supervision, Chauffeur, Drive, and EyeQ. Meanwhile, management has been working hard to secure new ADAS deals with large customers, while finding new opportunities with untapped clients. One driving force for the company is a growing adoption of multicamera setups due to the need for increased safety and a push toward hands-free highway driving.

Adding to Mobileye’s growth is its strategic partnerships, including ZEEKR, using Mobileye as its launch partner for its ADAS, and its design wins with automakers such as Porsche and Mahindra, among other major OEMs. Just this spring, Volkswagen announced a collaboration with Mobileye to improve safety and driving comfort for some of its upcoming vehicle pipeline.

The company remains unprofitable, with full-year guidance expecting an operating loss between $436 million to $512 million. That said, Mobileye boasts roughly $1.7 billion in cash and cash equivalents, rising free cash flow, very little debt, and should be able to navigate choppy waters as the industry slowly figures out the path to full autonomous vehicles.

The business of connectivity

Aptiv PLC (APTV -2.47%) is a technology company working to bring the next generation of active safety, autonomous vehicles, smart cities, and connectivity through its decades of experience pioneering advances in the automotive industry.

While the stock has faltered from its all-time highs as electric vehicle hype died down with slower-than-anticipated adoption in the U.S. market, it’s still performing well, with earnings expected to check in at $7.48 per share in 2025, up significantly from $2.61 in 2021 — a compound annual growth rate of 30%.

Aptiv sensors graphic.

Image source: Aptiv.

But its growth prospects might improve even more, with the company’s business split on the horizon for the first quarter of 2026. Aptiv plans to split into two companies: one that will focus on slower-growth electrical distribution systems (EDS), and the second on faster-growth safety and software — the latter aimed at a more driverless vehicle focus.

It’s easy to understand the rationale behind the business breakup when you consider the EDS business generated 2024 sales of $8.3 billion at earnings before interest, taxes, depreciation, and amortization (EBITDA) profit margins of 9.5%, while the safety and software generated 2024 sales of $12.2 billion with EBITDA margins nearly double at 18.8%.

The new Aptiv with a focus on safety and software that enable higher levels of autonomous functions won’t be limited to vehicles either, with potential applications for planes and other machines. Aptiv has already begun branching out its overall business with its communications software acquisition of Wind River in 2022.

All things autonomous

Hesai Group (HSAI -11.13%) is a global leader in lidar solutions, with its products enabling a wide range of applications including passenger and commercial vehicles ADAS, autonomous vehicles, robotics, and nonautomotive applications such as last-mile delivery robots.

Throughout the company’s second quarter, Hesai secured a notable number of new design wins through 2026, with 20 models from nine leading OEMs, highlighted by a platform win for multiple 2026 models with one of its top two ADAS customers. The design wins help cement lidar as a standard feature across the specific customer’s model lineups and will drive the company’s order book higher in the near term.

Outside its automotive wins, the company’s robotics business is also doing well, ranking No. 1 in lidar shipments in China for the first half of 2025, per Gaogong Industry Research Institute. Its robotics business is well positioned for the wave of physical artificial intelligence (AI), with lidars becoming essential for AI to perceive and sort the dynamic world we operate in, especially in driverless vehicles.

“In the first six months of 2025, total shipments have already surpassed those of full-year 2024. According to Gasgoo, we ranked first in installation volume among long-range lidar suppliers during this period,” said Hesai cofounder and CEO Yifan “David” Li in a press release.

Are the stocks buys?

The number of robotaxis and driverless vehicles on the roads is set to increase in the coming years, especially as leading autonomous vehicle operators reduce costs and begin scaling the business. Right now, roughly 1,500 such vehicles operate across a handful of U.S. cities, but that figure is expected to soar to about 35,000 across the country in 2030.

Even then, driverless vehicles will represent a fraction of the rideshare market, leaving plenty of long-term growth for investors who believe these companies have injected their technologies and solutions into the industry. Mobileye, Aptiv, and Hesai are all proven companies with products poised to push the boundaries of driverless vehicles, robotaxis, and ADAS going forward, and savvy investors would be wise to keep them on a watch list.

Source link

Prediction: 3 Cryptocurrencies That’ll Be Worth More Than Dogecoin 5 Years From Now

Can the original meme coin keep its top-10 crypto ranking for five more years? These three utility-focused cryptocurrencies suggest otherwise.

Dogecoin (DOGE -17.67%) was never really supposed to be a functional cryptocurrency. It’s a clone of a clone of Bitcoin with a few funny tweaks to the code, intentionally making Dogecoin less secure and less valuable in the long run.

Yet, its adorable dog mascot and support from popular meme lords made Dogecoin one of the most valuable cryptos on the planet. With a $37.6 billion market cap as of Oct. 9, it would be a mid-range member of the S&P 500 (SNPINDEX: ^GSPC) if it were a stock, comparable to household names like Yum! Brands or Delta Air Lines.

But these things change over time. Five years ago, Dogecoin was only the 43rd-largest name in crypto, with a $328 million market value. About one-third of the coins ranked above it in 2020 have fallen out of the top-100 list, according to CoinMarketCap.

And I think Dogecoin’s days in the spotlight are numbered. Thanks to firmer regulation, the advent of crypto-based exchange-traded funds (ETFs), and the incoming Web3 trend, the top coins of the relatively near future will have to prove their worth with real-world usage. Dogecoin doesn’t have much to offer in that department. By 2030, I expect Chainlink (LINK -15.25%), Avalanche (AVAX -14.17%), and Polkadot (DOT -21.71%) to have passed Dogecoin’s market value.

A Shiba Inu dog stares right into the camera.

Sorry Doge, these coins are stealing your lunch. Image source: Getty Images.

Let’s talk about the Web3 revolution

Spoiler alert: I’ll keep coming back to Web3 ideals in these explanations. Cryptocurrencies should go mainstream in that world, where internet users own their data, digital assets, and online identities through blockchain technology rather than relying on big tech companies.

I mean, most people may be unaware of the Web3 changes going on behind the scenes, and the best Web3 apps will surely look and feel like any other application. But the structural changes are still necessary, and that’s why I like this particular trio of future crypto giants.

1. Polkadot connects the crypto universe

On that note, I have to mention Polkadot. It’s the brainchild of the Web3 Foundation, founded by Web3 champion and Ethereum (ETH -6.65%) co-founder Gavin Wood.

Polkadot’s main purpose is to help app developers take full advantage of many other cryptocurrencies and blockchain ledgers. It connects to the other cryptos, easily transferring data between them and simplifying the design of complex crypto apps.

It’s also incredibly fast, which comes in handy when interacting with some of the highest-performance crypto systems available. And thanks to a recent community vote, there is now a hard cap on the number of Polkadot coins that will ever exist — making it as inflation-resistant as Bitcoin.

Polkadot is much smaller than Dogecoin today, with a market cap of just $6.6 billion. That value relationship should flip by 2030.

2. Smart contracts would be pretty dumb without Chainlink

Chainlink is another crucial Web3 component. The leading oracle coin collects real-world data and delivers it to blockchain systems, usually to trigger smart contracts.

Development ecosystems such as Ethereum and Polkadot often rely on Chainlink to collect critical data. Popular data feeds include stock market pricing, foreign exchange rates, weather reports, and sports results. Without these data feeds, the Web3 world would grind to a halt — and Chainlink is the top data provider by far.

Chainlink is currently the 11th-largest cryptocurrency, with a market capitalization of $15 billion. This figure should trend higher over the next few years as Dogecoin fades.

3. Avalanche brings eco-friendly speed to Web3

Finally, Avalanche is a high-performance alternative to Ethereum. This coin combines quick smart contract execution with an energy-efficient computing back-end, making Avalanche a popular platform for eco-friendly decentralized apps.

And the Avalanche-based app portfolio is growing by leaps and bounds right now. Fresh examples include a global social network for sports fans, a decentralized fine wine database, and digital tickets to the Latin American baseball championships of 2025. These projects all hit the public market in the last two weeks.

Avalanche’s market cap stands at $12.0 billion today, up from $7.7 billion six months ago. Avalanche is a vibrant cryptocurrency with a real shot at Web3 relevance. Sorry, Dogecoin — Avalanche will probably also eclipse you in the next five years.

Anders Bylund has positions in Bitcoin, Chainlink, Ethereum, and Polkadot. The Motley Fool has positions in and recommends Avalanche, Bitcoin, Chainlink, and Ethereum. The Motley Fool recommends Delta Air Lines. The Motley Fool has a disclosure policy.

Source link

Nvidia Has a Brilliant AI Business Poised to More Than Double Revenue to $20-Plus Billion This Year, Yet It Gets Little Coverage

Nvidia’s sovereign AI business is on track to grow annual revenue much faster than its overall business.

In late August, I was listening to Nvidia‘s (NVDA -4.84%) earnings call for its fiscal second quarter (ended July 27). When Colette Kress, CFO of the artificial intelligence (AI) tech leader, gave quantifiable data about the company’s sovereign AI business, I thought, “Finally!” as such data is only rarely shared.

Nvidia’s sovereign AI business is growing like gangbusters. It appears to be the biggest growth engine of the company’s AI-driven data center platform, which accounts for the bulk of Nvidia’s total revenue. Yet, it gets little coverage in the financial press.

“Sovereign entities” are those that are independent and have total or at least significant control within their borders. This includes many nations, U.S. states, and the European Union (EU).

Letters

Image source: Getty Images.

Nvidia “on track to achieve over $20 billion in sovereign AI revenue this year”

From Kress’ remarks on last quarter’s earnings call:

Sovereign AI is on the rise as the nation’s ability to develop its own AI using domestic infrastructure, data, and talent presents a significant opportunity for NVIDIA Corporation. NVIDIA Corporation is at the forefront of landmark initiatives across the UK and Europe. …

We are on track to achieve over $20 billion in Sovereign AI revenue this year, more than double that of last year.

I’ll put the $20 billion in context below.

Kress said that the EU plans to invest 20 billion euros to establish 20 AI factories in France, Germany, Italy, and Spain. This will include five gigafactories, and it will increase its AI compute infrastructure by 10-fold.

A “gigafactory” means that the AI compute facility will contain the number of Nvidia’s graphics processing units (GPUs) — which dominate the market for AI chips — that require at least 1 gigawatt of power. For context, 1 gigawatt (or 1,000 megawatts) equates to about the power output of a large-scale nuclear power plant.

Nvidia CEO: “Nations are investing in AI infrastructure like they once did for electricity and the Internet.”

The above quote is from CEO Jensen Huang’s remarks on Nvidia’s fiscal first-quarter earnings call in May. Here are more Huang snippets from that call:

I was honored to join him [President Donald Trump, in May] in announcing a 500-megawatt AI infrastructure project in Saudi Arabia …

[In May,] we announced Taiwan’s first AI factory … Last week, I was in Sweden to launch its first national AI infrastructure. Japan, Korea, India, Canada, France, the UK, Germany, Italy, Spain, and more are now building national AI factories to empower startups, industries, and societies. … [N]ations are investing in AI infrastructure like they once did for electricity and the Internet.

All the countries that Huang rattled off as building sovereign AI infrastructure are using Nvidia’s GPUs and related technology. Talk about big customers!

Putting the sovereign AI business’ projected annual growth in context

For the current fiscal year (fiscal 2026, which ends in late January), Wall Street expects Nvidia’s revenue to be $206.5 billion, up 58% from $130.5 billion last fiscal year. If that estimate proves relatively accurate and the sovereign AI business brings in revenue of $20 billion, it will account for about 9.7% of total revenue. And Kress said “over $20 billion,” so the percentage could be higher.

Below are more stats for further context.

Nvidia Market Platform

First-Half Fiscal 2026 Revenue Year-Over-Year-Growth*
Data center $80.2 billion 64%
Gaming $8.1 billion 46%
Auto $1.2 billion 70%
Professional Visualization $1.1 billion 26%
Total $90.8 billion 62%

Data source: Nvidia. *Calculations by author.

The above are half-year stats, but they give you an idea of what a standout performer Nvidia’s sovereign AI business is. Given the annual projections Kress shared, this business probably generated first-half revenue in the ballpark of $8 billion, or 10% of the data center’s revenue, and likely grew 100%-plus year over year.

Why Nvidia’s sovereign AI strategy is particularly brilliant

Nvidia is not only selling its technology to sovereign entities, it’s also assisting them in their massive undertakings. These relationships should make Nvidia’s sovereign AI business especially “sticky.” Countries that are happy with Nvidia are likely to stick with Nvidia when they want to upgrade or expand their AI infrastructure.

The sovereign AI business should also lead to other opportunities for Nvidia. Companies, researchers, and technology students that use and become familiar with a country’s sovereign AI infrastructure will probably be more likely to buy Nvidia’s offerings if and when they need their own AI-enabling tech.

Source link

41 States That Don’t Tax Social Security Benefits

Most Social Security recipients will be able to avoid paying taxes on their benefits.

People spend years paying into the Social Security system via payroll taxes. It’s a way of helping to secure somewhat of a financial safety net in your retirement years when you begin receiving benefits. Even if you’re fortunate enough not to need it, it’s a well-earned plus after decades of work and contributions.

Unfortunately, like most other income sources in America, when you receive your Social Security payments, you could potentially owe taxes on them. The good news is that most states don’t tax Social Security benefits. The bad news is that this still leaves others that do. As of October 2025, 41 states do not tax Social Security.

Social Security card placed among several $100 U.S. dollar bills.

Image source: Getty Images.

Which states don’t tax Social Security benefits?

The following 41 states, along with Washington, D.C., currently do not tax Social Security benefits:

  1. Alabama
  2. Alaska
  3. Arizona
  4. Arkansas
  5. California
  6. Delaware
  7. Florida
  8. Georgia
  9. Hawaii
  10. Idaho
  11. Illinois
  12. Indiana
  13. Iowa
  14. Kansas
  15. Kentucky
  16. Louisiana
  17. Maine
  18. Maryland
  19. Massachusetts
  20. Michigan
  21. Mississippi
  22. Missouri
  23. Nebraska
  24. Nevada
  25. New Hampshire
  26. New Jersey
  27. New York
  28. North Carolina
  29. North Dakota
  30. Ohio
  31. Oklahoma
  32. Oregon
  33. Pennsylvania
  34. South Carolina
  35. South Dakota
  36. Tennessee
  37. Texas
  38. Virginia
  39. Washington
  40. Wisconsin
  41. Wyoming

Which states tax Social Security benefits?

The following nine states do have Social Security taxes in some form:

  1. Colorado
  2. Connecticut
  3. Minnesota
  4. Montana
  5. New Mexico
  6. Rhode Island
  7. Utah
  8. Vermont
  9. West Virginia

In the past five years, four states have eliminated their Social Security tax, so there’s still hope for people who live in a state with the tax. For example, West Virginians won’t have to pay taxes on benefits beginning in 2026.

You could still owe federal taxes on your Social Security check

Unfortunately, your state’s tax-free status doesn’t exempt you from federal taxes on your Social Security check. Luckily, most people won’t pay anything; however, there are still millions who will. To determine if you’ll be subjected to federal taxes on your Social Security benefits, the IRS considers your combined income, which includes the following:

For example, if your AGI is $15,000, you receive $20,000 annually from Social Security, and you have $200 in nontaxable interest, your combined income would be $25,200 ($15,000 + $10,000 + $200). After calculating your combined income, the following ranges are used to determine how much of your benefits are eligible to be taxed:

Percentage of Taxable Benefits Added to Income Filing Single Married, Filing Jointly
0% Less than $25,000 Less than $32,000
Up to 50% $25,000 to $34,000 $32,000 to $44,000
Up to 85% More than $34,000 More than $44,000

Source: IRS.

To see it in action, let’s assume you receive $20,000 annually in benefits, and 50% is eligible to be taxed. In this situation, up to $10,000 would be added to any other income you have and then taxed at your normal income tax rate. It’s helpful to know how the federal tax works, so you don’t mistakenly assume that the IRS is going to take 50% or 85% of your benefits.

Some retirees could see a larger tax deduction

The Trump administration’s “big, beautiful bill” included a provision that provides a temporary tax deduction for eligible people age 65 and older. Single filers are eligible for up to $6,000, while couples filing jointly are eligible for up to $12,000.

To qualify for the full $6,000 deduction, single filers must have a modified adjusted gross income (MAGI) below $75,000. If your MAGI is between $75,000 and $175,000, you’re eligible for a reduced deduction, with the amount depending on where your income falls in the range.

Couples filing jointly must have a MAGI below $150,000 to qualify for the full $12,000. Any couple with a MAGI between $150,000 and $250,000 is eligible for the reduced deduction.

This deduction will remain in place until 2028 and is available even if you take the standard deduction (which would otherwise prohibit you from itemizing your deductions).

Source link

Where Will CoreWeave Stock Be in 5 Years?

The possibilities for CoreWeave’s future are all over the map. But a middle-of-the-road scenario looks quite promising.

What’s the most exciting initial public offering (IPO) of 2025? My vote would go to CoreWeave (CRWV -3.25%). Its IPO was the biggest for a tech stock since 2021.

Sure, CoreWeave had to lower its planned IPO share price. However, that was due more to broader market headwinds than anything related to the company itself. At any rate, CoreWeave stock has nonetheless performed exceptionally well. It ranks among the biggest large-cap winners of the year.

But that’s all water under the bridge now. Where will CoreWeave stock be in five years?

AI on a blue cloud with lights in the background.

Image source: Getty Images.

CoreWeave’s future largely hinges on three key factors

To make an educated guess about CoreWeave’s prospects, we have to first understand its business. The company is one of a handful of artificial intelligence (AI) hyperscalers. Its sole focus is providing infrastructure designed to support the workloads of AI systems, especially generative AI applications.

The most important factor affecting where CoreWeave stock will be in 2030 is almost certainly how strong the demand for AI infrastructure will be through the rest of the decade. As of right now, the prognosis looks great. Exhibit A is that CoreWeave’s revenue more than tripled year over year in its latest quarter.

Next on the list, in my view, is how well CoreWeave can keep up with the demand. CEO and co-founder Michael Intrator said in the company’s Q2 update, “We are scaling rapidly as we look to meet the unprecedented demand for AI.” Such a massive buildout is expensive. That’s the main reason CoreWeave remains unprofitable.

Electricity supply could also be a constraint. Consulting giant Deloitte estimates that power demand from U.S. AI data centers could skyrocket more than 30x by 2035 to 123 gigawatts.

CoreWeave’s future hinges on a third factor, too: competition. The hyperscaler’s rivals include some of the biggest companies on the planet with exceptionally deep pockets. If AI infrastructure demand slows, the competitive threats could become more pronounced.

Potential scenarios

With those factors in mind, let’s explore a few potential scenarios for CoreWeave. I’ll start with the most optimistic one.

An explosion in AI infrastructure demand fueled by AI advances

The AI demand we’ve seen thus far could be only the tip of the iceberg. Agentic AI remains in its early stages of adoption. Artificial general intelligence (AGI) and artificial superintelligence (ASI) aren’t the stuff of science fiction anymore. Major companies are investing heavily in developing these game-changing AI breakthroughs.

In this scenario, CoreWeave’s growth would be impressive. The company could probably generate revenue of over $200 billion in 2030. At the current average price-to-sales ratio of 8 for the internet services and infrastructure industry, that would translate to a market cap for CoreWeave of at least $1.6 trillion — a gain of roughly 23x in five years.

One wrinkle in this scenario, though, is that the biggest hyperscalers could view CoreWeave as an attractive acquisition target to boost their own capacity. The purchase price would depend on the timing of such a potential buyout: The earlier in the AI infrastructure explosion, the less expensive acquiring CoreWeave would be.

Solid AI infrastructure demand growth

In this scenario, AI infrastructure demand continues to grow at a robust (although not explosive) pace. We probably wouldn’t see AGI or ASI emerge over the next five years. However, agentic AI could gain more widespread adoption.

I think CoreWeave could realistically rake in revenue in the ballpark of $60 billion in this scenario. That number reflects an increase of around 12x from Wall Street’s consensus revenue estimate for 2025. Using the average industry P/S multiple of 8, that would put CoreWeave’s market cap at $480 billion or so. Its share price would need to grow nearly 7x to hit that mark.

Weak AI infrastructure demand growth

Now, let’s suppose AI infrastructure demand tapers off dramatically. This scenario would likely be devastating for CoreWeave. Its stock already has significant growth baked into the share price with a P/S ratio of 19.

If CoreWeave fell to the current industry average P/S multiple, its stock could plunge by at least 50%. However, I suspect that the average would itself decline quite a bit if AI infrastructure demand slowed to a crawl. A decline of 70% or more for CoreWeave’s share price probably wouldn’t be out of the question in this scenario.

A prediction for CoreWeave in 2030

The easiest prediction for CoreWeave in 2030 is to go with something along the lines of the middle-of-the-road scenario mentioned above. Even if that scenario is still overly optimistic, I could easily see CoreWeave being worth at least $200 billion by the end of the decade. A gain of almost 3x in just five years isn’t too shabby.

Keith Speights has no position in any of the stocks mentioned. The Motley Fool has no position in any of the stocks mentioned. The Motley Fool has a disclosure policy.

Source link

The “Magnificent Seven” or the Entire S&P 500: What’s the Better Option for Growth Investors?

The big names in tech have been doing well of late, but a slowdown could be overdue.

If you’re thinking about investing in the stock market today, you may be wondering whether it’s a better idea to go with the big names in the “Magnificent Seven” or to simply hold a position in the entire S&P 500.

The Magnificent Seven refers to some of the most prominent growth stocks in the world: Alphabet, Amazon, Apple, Meta Platforms, Microsoft, Nvidia, and Tesla. Investing in these companies has yielded strong returns for investors over the years. Meanwhile, the S&P 500 makes for a more balanced investment overall, as it gives investors broader exposure to the market while still growing over the long term. By having a position in the 500 best stocks rather than just the top seven, there’s much more diversification.

Which option should you go with today, if your focus is on long-term growth?

A couple using a laptop and reviewing documents.

Image source: Getty Images.

The Magnificent Seven are magnificent, but they could be overdue for a decline

One way you can gain exposure to the Magnificent Seven is by investing in the Roundhill Magnificent Seven ETF (MAGS -3.81%). The fund invests in just the Magnificent Seven and, thus, can be an easier option than investing in each stock individually. Since its launch in April 2023, the fund has soundly outperformed the S&P 500, rising by more than 165% while the broader index has achieved gains of around 64%.

Many of the Magnificent Seven have benefited from an uptick in demand due to artificial intelligence (AI) and have been investing heavily in next-gen technologies. However, many investors worry that a bubble has already formed around AI stocks and that spending could slow down, especially if there’s a recession on the horizon. If that happens, then these stocks could be susceptible to significant declines.

While these stocks have been flying high of late, back in 2022, when the market was in turmoil due to rising inflation and as investor sentiment was souring on growth stocks, each of the Magnificent Seven stocks fell by more than 26%. The worst-performing stocks were Meta and Tesla, which lost around 65% of their value. That year, the S&P 500 also fell, but at 19%, it was a more modest decline.

The S&P 500 is more diverse, but that doesn’t mean it’s risk-free

If you want to have exposure to the S&P 500, you can accomplish that by investing in an S&P 500 index fund, such as the SPDR S&P 500 ETF (SPY -2.67%). Its low expense ratio of 0.09% makes it a low-cost, no-nonsense way of tracking the S&P 500. Its focus is to simply mirror the index, and it does a great job of that.

The problem, however, is that while the S&P 500 will give you exposure to more stocks than just the seven best stocks in the world, how those leading stocks do will still have a significant impact on the overall stock market. And the Magnificent Seven, because they are so valuable, are also among the SPDR ETF’s largest holdings.

But even if you were to go with a more balanced exchange-traded fund, such as the Invesco S&P 500 Equal Weight ETF, which has an equal position in all S&P 500 stocks, that may only offer modest protection from a wide-scale sell-off. In 2022, the ETF declined by 13%.

You’re always going to face some risk when investing in the stock market, especially if your focus is on growth stocks, which can be particularly volatile.

What’s the better strategy for growth investors?

If your priority is growth, then going with the Magnificent Seven can still be the best option moving forward. These stocks will undoubtedly have bad years, but that’s the risk that comes with growth stocks. However, given their dominance in tech and AI, the Magnificent Seven still have the potential to vastly outperform the S&P 500 in the long run, and their gains are likely to far outweigh their losses.

David Jagielski has no position in any of the stocks mentioned. The Motley Fool has positions in and recommends Alphabet, Amazon, Apple, Meta Platforms, Microsoft, Nvidia, and Tesla. The Motley Fool recommends the following options: long January 2026 $395 calls on Microsoft and short January 2026 $405 calls on Microsoft. The Motley Fool has a disclosure policy.

Source link

Great News for Nvidia Stock Investors!

Despite the bullish sentiments in the AI industry, new data continues to suggest that sales will be even higher than previously expected.

Where to invest $1,000 right now? Our analyst team just revealed what they believe are the 10 best stocks to buy right now. Continue »

*Stock prices used were the afternoon prices of Oct. 8, 2025. The video was published on Oct. 10, 2025.

Should you invest $1,000 in Nvidia right now?

Before you buy stock in Nvidia, consider this:

The Motley Fool Stock Advisor analyst team just identified what they believe are the 10 best stocks for investors to buy now… and Nvidia wasn’t one of them. The 10 stocks that made the cut could produce monster returns in the coming years.

Consider when Netflix made this list on December 17, 2004… if you invested $1,000 at the time of our recommendation, you’d have $663,905!* Or when Nvidia made this list on April 15, 2005… if you invested $1,000 at the time of our recommendation, you’d have $1,180,428!*

Now, it’s worth noting Stock Advisor’s total average return is 1,091% — a market-crushing outperformance compared to 192% for the S&P 500. Don’t miss out on the latest top 10 list, available when you join Stock Advisor.

See the 10 stocks »

*Stock Advisor returns as of October 7, 2025

Parkev Tatevosian, CFA has positions in Nvidia. The Motley Fool has positions in and recommends Nvidia. The Motley Fool has a disclosure policy. Parkev Tatevosian is an affiliate of The Motley Fool and may be compensated for promoting its services. If you choose to subscribe through his link, he will earn some extra money that supports his channel. His opinions remain his own and are unaffected by The Motley Fool.

Source link

This Is What Really Happens When You Withdraw $10,000 From Your Bank Account

Withdrawing $10,000 from your checking or savings account might not be a big deal for some. But no matter why you do it, your bank’s going to let the federal government know about it.

Here’s what happens when you take out $10,000 or more — and why you probably don’t need to worry about it.

Your bank files a report with the government

Here’s the law: Financial institutions must file a report known as a Currency Transaction Report (CTR) for any cash withdrawal or deposit over $10,000. The report then goes to the Financial Crimes Enforcement Network (FinCEN), a bureau of the U.S. Department of the Treasury.

This is to help prevent money laundering, fraud, and organized crime. The report also includes your name, account details, transaction amount, and how the money was taken out — whether it was cash, check, or some other form.

A CTR is shared with several agencies, including the IRS. That’s not a big deal so long as you’re doing nothing illegal, but it could lead the IRS to take a closer look at your finances.

You might think you can dodge the CTR by withdrawing $5,000 now and $5,000 later. Don’t do it. Your bank could file a Suspicious Activity Report (SAR) for withdrawals under $10,000 if they think you’re trying to game the system.

Did you know you don’t need to take money out of your savings account to earn a solid return? Right now, top high-yield savings accounts are offering APYs of 3.80% or more, which means you could be earning $380 a year in interest on your $10,000.

For a better place to store your cash, check out our list of the best high-yield savings accounts available today.

The takeaway: Don’t panic, be transparent

Taking $10,000 out of your checking or savings account isn’t illegal or even uncommon. But it also doesn’t happen without the government taking notice.

If you need to take out a large amount of money, do it all at once. If anyone asks what it’s for, be honest. There’s nothing wrong with accessing your cash, but transparency is key.

And if you’re not committing fraud or doing anything else illegal, you won’t have any reason to worry.

Want to earn more on your savings? See our full list of the best high-yield savings accounts to start earning 3.80% APY or higher now.

Source link