According to Experian data, the average American driver pays roughly $2,328 per year for full coverage auto insurance in 2025. If you carry only the minimum coverage required by your state, that drops to about $1,546 annually.
Of course, those are just averages. Your actual rate might be far higher or much lower. It all depends on personal factors, like where you live, what kind of car you drive, and your claims history.
So how do you stack up?
My personal rate
For example, my current full-coverage policy runs about $1,047 a year here in California. I’ve got a clean driving record, great credit, a family minivan (yep, full dad mode), and I only rack up around 6,000 miles a year.
I pay less than half the national average — but it didn’t happen by luck. I make it a habit to compare quotes every so often and keep my profile in top shape.
Insurance companies use dozens of factors to gauge your risk and determine your policy rate.
Some of these factors you can control, others not so much.
Here are the biggest ones that matter:
Location: Rates differ wildly by state and even ZIP code. Drivers in Maryland, for instance, might pay more than double what drivers in Vermont do.
Driving record: Tickets, accidents, and DUIs can raise your rate for years.
Vehicle type: Minivans and sedans generally cost less to insure than luxury or sports cars.
Credit score: In most states, a higher credit score can help lower your premium.
Annual mileage: Driving less typically means less risk — and lower rates.
Coverage level: Full coverage offers stronger protection but costs more.
Deductible: Choosing a higher deductible can reduce your monthly premium.
Knowing which levers you can pull gives you real control over your rate.
Why it pays to compare
Every year, your car gets a little older, your driving record gets a little longer, and your situation changes. Maybe you’re driving less, moved somewhere safer, or finished paying off your car.
Meanwhile, most insurance companies raise your rate each renewal — even if nothing about your risk has changed. It’s just how the system works.
That’s why checking rates once a year can pay off big.
In fact, Consumer Reports found that nearly 1 in 3 drivers switched auto insurers in the past five years. And those who did saved an average of $461 a year.
Since it only takes a few minutes to shop around, it’s always worth checking if better rates are available out there.
Personally, I like to check insurance prices once a year. Most of the time, I find I’m already getting the best deal. But every so often, I stumble across a lower rate for the exact same coverage!
As someone who’s lived in and visited family throughout the Inland Empire for years, I have seen firsthand the rapid growth that has changed the region.
When I travel to Yucaipa nowadays, the orange groves of my youthful weekend visits have long since been replaced by housing developments as the town has nearly doubled in 30 years.
My colleague Terry Castleman has been analyzing the demographic changes taking place in California but he recently took a deep dive into the explosive growth of income in the Inland Empire, in particular the south desert portion of Riverside County.
Castleman, a data reporter, noted that two of the top three communities that saw the greatest growth in average income in the state between 2017 and 2022 were in the Coachella Valley, perhaps best known for hellish summer temperatures, Palm Springs and the Coachella Valley Music & Arts Festival.
You’re reading the Essential California newsletter
Our reporters guide you through the most important news, features and recommendations of the day.
For this analysis, The Times considered only communities with more than 3,000 tax returns. I’ll address the cities with fewer returns shortly.
Thousand Palms saw average incomes rise more than 3.5 times over that span, from $12,700 in 2017 to nearly $45,000 three years later. In nearby Indian Wells, incomes nearly doubled, from $139,000 to $256,000.
The Coachella Valley is experiencing a desert bloom
Income levels in Thousand Palms were far lower than in Indian Wells — but each is getting richer from a regionwide perspective, said Kyle Garman, an agent for Keller Williams who has sold real estate in the Coachella Valley for eight years.
Part of the story is attributable to remote work, he said, but the valley has also undergone a shift from being primarily a tourist destination to a place to settle down.
“It’s not just Palm Springs, it’s not just people coming for the festivals, it’s the whole valley,” Garman said.
Before the COVID-19 pandemic, home prices were much lower and only about 35% to 40% of residents stayed for the hottest months of the year, he said. As more attractions and infrastructure have become available to residents, though, “people are sticking around more.”
So, who is moving in?
The average California household has a net worth between three and six times their adjusted gross income, meaning that the average Indian Wells resident probably became a millionaire between 2017 and 2022 as average household income skyrocketed to $256,000 from $139,000.
In the Coachella Valley, “the money’s coming from all over,” Garman observed. When the housing market was most competitive, around 2022 and 2023, cash buyers flooded in.
Now, they’re high earners who have relocated to towns that were formerly less tony. “This is the new norm,” he said.
Garman pointed to a number of new Coachella Valley attractions that were drawing families — the Firebirds professional ice hockey team and Disney’s Cotino housing development.
Thousand Palms is unincorporated, drawing homeowners because, as one businessperson there put it: “Taxes are more reasonable, you have fewer regulations when you want to build.”
Notes that didn’t make Castleman’s cut
When Castleman looked at the income changes in smaller towns, he found some intriguing data.
He discovered staggering income jumps in towns like Helm, an unincorporated Fresno County village that has about 200 residents.
Between the 2017-2022 period, Helm saw incomes grow by 10 times, reaching near $200,000.
Castleman said many smaller towns throughout the state are disproportionately impacted by the moves of one or a handful of “big fish.”
“The experts told me that there was likely a big farm owner who reported huge losses one year and then huge gains the next year,” he said. “So, these towns can have wild fluctuations.”
Have a great weekend, from the Essential California team
Jim Rainey, staff writer Kevinisha Walker, multiplatform editor Andrew J. Campa, reporter Hugo Martín, assistant editor Karim Doumar, head of newsletters Diamy Wang, homepage intern Izzy Nunes, audience intern
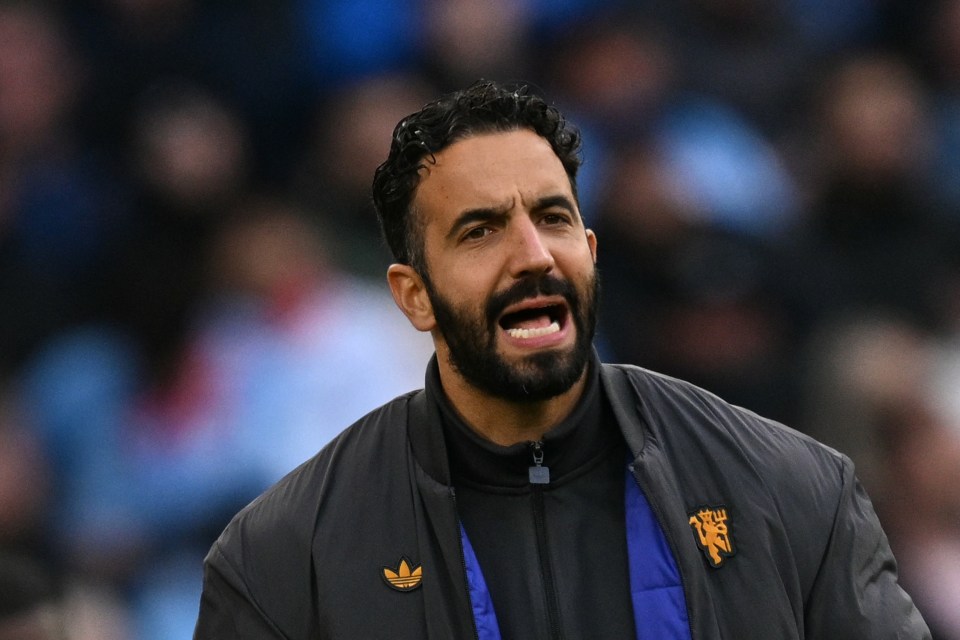
BRYAN ROBSON has told Manchester United chiefs to back Ruben Amorim for the long haul and slammed the club’s recent history of signing flops.
The United legend says the revolving door of managers since Sir Alex Ferguson’s retirement in 2013 has wrecked any chance of stability, and insists under-fire former Sporting Lisbon boss must be given at least THREE years to fix the mess.
4
Robson moved to United for a British record transfer fee of £1.5 million in 1981Credit: Getty
4
Robson has backed Amorim to get things right at UnitedCredit: AFP
4
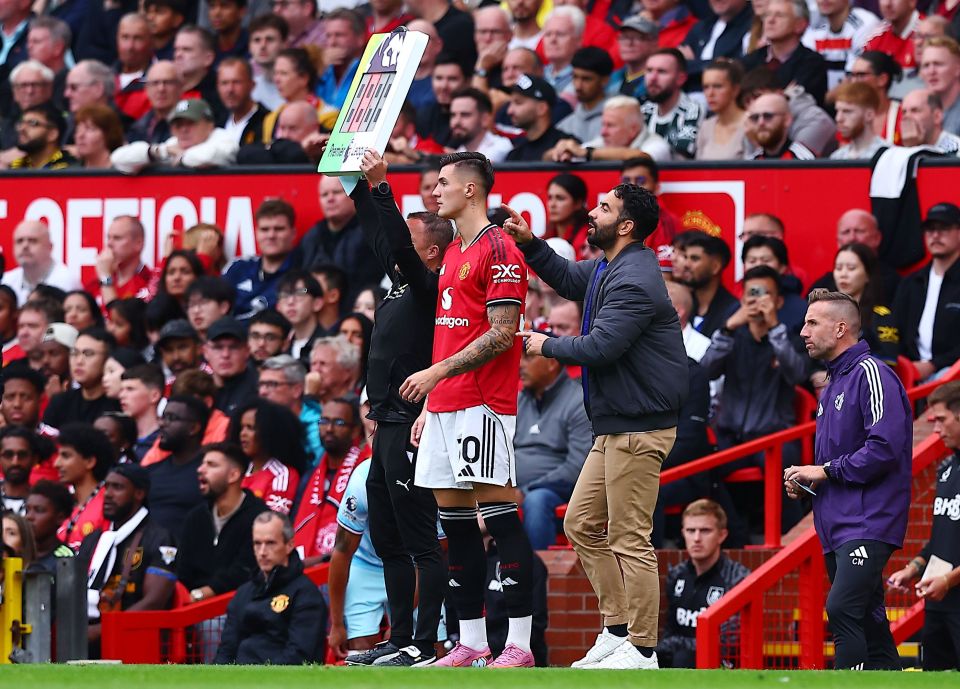
Manchester United stars are under-performing despite Amorim being in charge for the last eight monthsCredit: Shutterstock Editorial
Speaking to The Telegraph, Robson said: “We’ve changed managers that many times since 2013.
“I feel you have to stick and say, ‘No, we are not sacking the manager. We are not blaming.’
“When you have a little bit of money and the club are going to allow you to change your squad, you need three years to get the team right.
“For me, three years at Manchester United should be enough.”
Amorim, 40, has had a disastrous start to life as United boss, winning just eight of his first 31 games.
But Robson is urging the board to give him more time, despite fans on social media calling for his sacking.
Robson didn’t hold back when reflecting on the transfer blunders of the Ed Woodward era, suggesting too many signings simply weren’t up to scratch.
He fumed: “Look at the money we spend. It’s up to you to go around the world and get top players who are going to improve you.”
“I think five years ago some of the players we bought were just not good enough to be Manchester United players. It’s an accumulation of that.”
And Robbo, who captained United through some of their most hard-fought years, believes the club lost its way by ignoring experienced Premier League stars in favour of flashy foreign names.
How Arsenal can beat Man City by exposing Rodri issue
“The other thing I think we went away from is getting good, experienced Premier League players.
“So when they get to 28, you bring them on board if you can. There have been loads of players who have left clubs.”
And his message to United’s decision-makers couldn’t be clearer.
He added: “When I was in management, I believed that if you bought average players, you got an average team.”
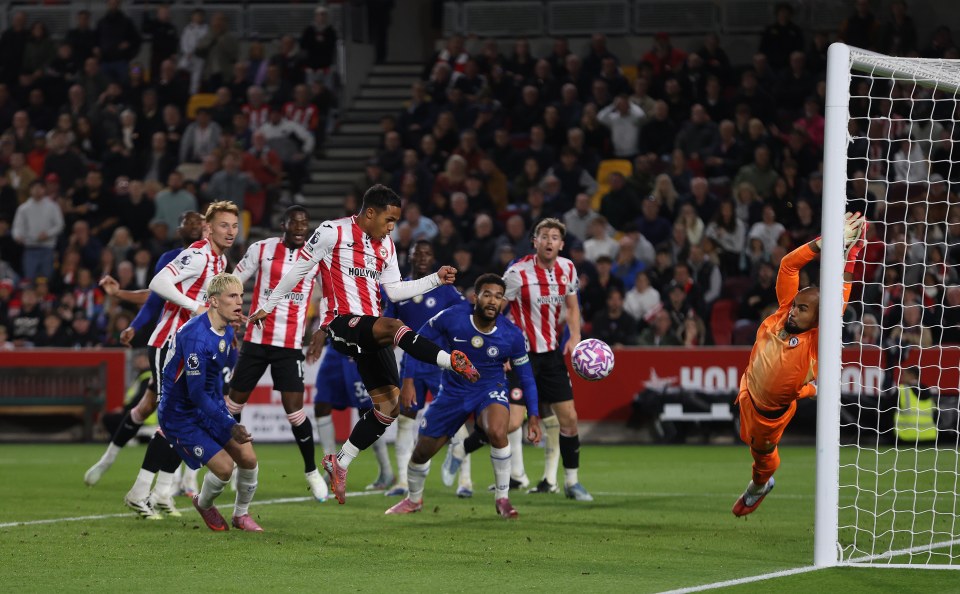
Fabio Carvalho scored a late equaliser for Brentford against Chelsea from a long throwCredit: Getty
2
There have been 130 long throw-ins so far in the Premier League so far this seasonCredit: Getty
And the statistics show that the Bees are not the exponents of old-fashioned Pulis-ball.
In the 40 Prem games so far this season, there have been 130 long throws, at an average of 3.3 per match.
That compares to last season’s average, over the 380 games, of 1.5 per match – a doubling of the frequency.
And senior figures believe the return of the long throw has been a factor in a significant shortage of actual playing time.
Figures provided by Stats Perform show that across the 40 top flight games the ball has only been in play for an average of 54 minutes and 21 seconds, down 133 seconds from last season’s average.
The analysis by Prem insiders suggests that one major reason is that the extra number of long throws has seen more teams sending their centre-backs up into the opposition box.
A similar amount of positioning, by both attacking and defending sides, at corner kicks, has also been noticed, with many sides now having specialist set-piece coaching teams.
And with goalkeepers unable to hold onto the ball for more than eight seconds under the new Laws, also taking longer at goal kicks when the ball goes out of play, fans are getting less value for their ticket prices.
Social Security was never intended to cover all of your expenses in retirement. Investing in growth stocks like Nvidia today could help you bridge the gap in your budget down the road.
Many retired Americans rely heavily on Social Security checks for their income, but often, those payments don’t stretch far enough to cover all of their expenses. According to government data, in 2025, the average Social Security benefit is just $1,976 per month.
If that doesn’t sound like much, that’s because it isn’t. A recent study projected that by 2040, 32.6 million U.S. households with retirement-age individuals could have an average cash shortfall of more than $7,000 annually. That gap between retirement income and retirees’ needs is a big reason why many Americans will need to do more to build their own portfolios of investments, rather than trying to rely on Social Security benefits alone.
If you’re on the hunt for stocks that could help you build wealth over the long haul that you can eventually tap in retirement, there are a few compelling reasons to make Nvidia(NVDA 0.43%) one of your picks.
Image source: Getty Images.
Why Nvidia could continue to be a good long-term investment
Nvidia has become a common go-to investment among both tech enthusiasts and average investors over the past few years, as the company is benefiting from a steep increase in spending on artificial intelligence infrastructure. Nvidia’s graphics processing units (GPUs) dominate the artificial intelligence (AI) data center market — it sells an estimated 70% to 95% of all AI chips for infrastructure.
In Q2, the company’s data center revenue jumped 56% year over year to $41 billion, and its non-GAAP earnings per share jumped 54% to $1.05. Eventually, Nvidia’s customers could slow their spending on its hardware — particularly if AI doesn’t deliver the results those companies are hoping for — but that day hasn’t come yet. Nvidia CFO Colette Kress estimates that tech companies will invest up to $4 trillion into AI data centers over the next five years.
And it’s not just AI data centers that could fuel Nvidia’s future growth. The company’s tech is already being used in autonomous vehicles, and advances in the robotics industry could create another expanding new market for it in the coming years. Some estimates forecast that the global autonomous vehicle market will grow to more than $2 trillion over the next five years, and Nvidia CEO Jensen Huang said recently that robotics (including autonomous vehicles) and AI represent a “multitrillion-dollar growth opportunity” for his company.
Though Nvidia stock has already soared by more than 1,100% over the past three years, the combination of its dominance in AI data center processors and its emerging opportunities in robotics and autonomous vehicles suggests it will remain a good long-term investment.
More growth could be ahead for Nvidia, but keep this in mind
While no single stock should make up the majority of your portfolio, investing in Nvidia could give future retirees a way to benefit from the massive transition toward AI systems that’s currently underway. While the chipmaker doesn’t currently pay a meaningful dividend, investors can eventually sell their holdings in retirement to supplement their incomes.
Planning for retirement can be challenging, and as you approach retirement age, it’s generally a good idea to reduce your exposure to stocks and other higher-risk investments. While Nvidia’s share price may continue to climb in the years ahead, it’s important to remember that it’s still a tech company, and tech stocks often go through periods of unusual volatility.
This shouldn’t be too much of a concern if you’ve got a long way to go before retirement, but remember that as you age, you’ll want to shift the balance of the allocations in your well-diversified portfolio toward less risky holdings.
Chris Neiger has no position in any of the stocks mentioned. The Motley Fool has positions in and recommends Nvidia. The Motley Fool has a disclosure policy.
The three worst-performing Dow stocks of August are still up over 17% each in 2025.
The Dow Jones Industrial Average (^DJI 1.36%) moved 3.2% higher in August, with five of its 30 constituent stocks rallying over 10% each. While the laggards didn’t decline as sharply, the fall in two of the three worst-performing Dow stocks of August was hard to justify.
Image source: Getty Images.
1. Microsoft: Down 5%
Shares of Microsoft(MSFT 0.20%) fell 5% last month because investors booked profits after the tech stock soared to all-time highs of $555.45 on July 31, and its market capitalization briefly surpassed $4 trillion for the first time ever.
On July 31, Microsoft posted 18% revenue and 24% net income growth for its fourth quarter, driven by artificial intelligence (AI) and cloud computing. Its cloud computing unit Azure logged the biggest revenue jump of 39% among all products. Microsoft projects double-digit growth in revenue and operating income for fiscal year 2026 (ending June 30, 2026).
2. Caterpillar: Down 4%
Shares of Caterpillar(CAT 2.04%) hit all-time highs of $441.15 on July 31. But unlike Microsoft, Caterpillar’s numbers sent the stock 4.3% lower in August.
Caterpillar’s second-quarter revenue declined 1%, and earnings per share slumped 16% year over year on unfavorable pricing. Although the construction and mining equipment giant expects higher revenue in 2025, it sees tariffs as a significant headwind to profitability. It projects free cash flow from its machinery, energy, and transportation businesses to be around $7.5 billion in 2025, versus $9.4 billion last year.
3. International Business Machines: Down 3.8%
International Business Machines (IBM 0.06%) stock dropped sharply on July 24 after releasing Q2 numbers and continued to fall through August, losing 3.8% in the month. Ironically, IBM’s revenue rose 8% year over year, and management now expects 2025 free cash flow to exceed its guidance of $13.5 billion, driven by growth in software.
Software alone made up 43% of IBM’s revenue in Q2. Last year, IBM generated $12.7 billion in FCF.
IBM shares fell because its software revenue growth missed analysts’ estimates. Investors know better, though, as the tech stock has recovered 5.5% this month, as of this writing.
Neha Chamaria has no position in any of the stocks mentioned. The Motley Fool has positions in and recommends International Business Machines and Microsoft. The Motley Fool recommends the following options: long January 2026 $395 calls on Microsoft and short January 2026 $405 calls on Microsoft. The Motley Fool has a disclosure policy.
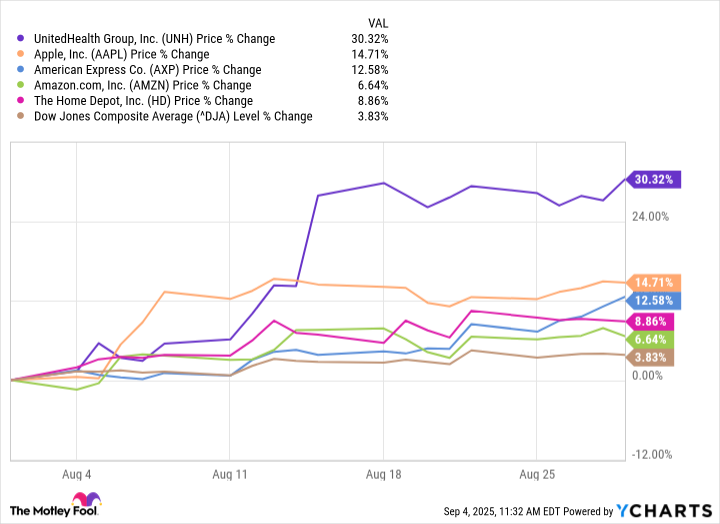
Good news and some surprise investments fueled Dow winners in August.
August 2025 was a big month for a handful of stocks in the Dow Jones Industrial Average. While the index, which tracks 30 of the most influential publicly traded companies in the U.S., was up 3.8% on the month, there were some outliers that drove the component’s overall performance even higher.
UnitedHealth Group(UNH 1.53%) stock has been a disappointment in 2025, down 50% heading into August. But it made a massive turnaround on a couple of key investments.
First, Berkshire Hathaway, led by famed CEO Warren Buffett, disclosed a $1.5 billion position in UnitedHealth, pocketing 5.04 million shares. It was a big move for Berkshire, which also operates an insurance company in GEICO, and signaled to investors that the beaten-down insurer was ripe for the picking.
Second, investor Michael Burry disclosed his own investment through his Scion Asset Management hedge fund. Burry, who’s best known for his bet against the housing market that was dramatized in The Big Short, disclosed that Scion bought 20,000 shares of UnitedHealth stock and another 350,000 call options.
The company’s second-quarter earnings were also solid, with revenue of $111.6 billion up $12.8 billion from a year ago. UnitedHealth issued full-year guidance for revenue between $344 billion and $345.5 billion, which would be up 15% from 2024.
Apple: Up 14.7%
Buffett’s cash to fund his UnitedHealth purchase came from his sale of Apple(AAPL -0.16%) stock. The Oracle of Omaha trimmed Berkshire’s stake by 20 million shares. But Apple had some other positive things going for it, so it still had a very good August.
First, Apple had a better-than-expected earnings report. Financials for its fiscal 2025’s third quarter (ended June 28) showed revenue of $94 billion, up 10% from a year ago. Earnings per share totaled $1.57, which was a 12% increase from last year.
Apple badly needed a quarter like that because the company’s revenue has been flat since 2023. While some investors were expecting more of the same, Apple was able to report double-digit growth in its iPhone, Mac, and Services segments.
American Express: Up 12.6%
American Express (AXP -1.30%) is a credit card company that has distinct advantages over competitors Mastercard and Visa. While it has a smaller market share, American Express caters to corporate accounts and affluent customers who crave the American Express gold or platinum card perks.
In addition, the company operates its own payment network and extends loans, giving it another income stream from the interest charged.
Although there remains some concern about the strength of the economy, American Express reported revenue that was up 9% in the second quarter to $17.8 billion. Adjusted earnings per share came in at $4.08, up 17% from the second quarter of 2024.
American Express isn’t sitting on its laurels, though. CEO Steve Squeri indicated that the company is looking to upgrade its Platinum card in an effort to draw Generation Z and millennial customers.
Amazon: Up 6.6%
Amazon(AMZN -1.46%) has multiple growth engines with its lucrative Amazon Web Services (AWS) cloud computing segment and its powerful e-commerce division. Both had good news to report in August, pushing Amazon shares higher.
First, the company’s second-quarter results showed strong performance from AWS, with revenue in the segment coming in at $30.87 billion and operating income of $10.16 billion. AWS is by far most profitable segment for Amazon, and its cloud computing division is essential for companies that are looking to operate artificial intelligence-infused programs without spending massive amounts of money to create their own data centers.
Image source: Getty Images.
Amazon also is seeing greater success with advertising. Its advertising-services segment brought in $15.69 billion in the second quarter, up 23% from the previous year.
Finally, the company’s Amazon Prime Day shopping event in July brought in billions. The company said it was the biggest Prime Day event in its history. While Amazon didn’t release sales figures yet, Adobe Analytics projected $23.8 billion in overall sales from the three-day event.
Home Depot: Up 8.8%
Home Depot(HD 1.69%) had a good August after reporting solid earnings of its own. As home sales are struggling in 2025, more people seem to be putting work into their existing properties, according to CEO Ted Decker, who cited “smaller home improvement projects” as driving the company’s successful quarter.
Home Depot said it saw sales of $45.3 billion in the second quarter, up 4.9% from a year ago. Adjusted earnings per share of $4.68 were $0.01 per share higher than a year ago. The home-improvement retailer reaffirmed its 2025 guidance for sales growth of 2.8%.
American Express is an advertising partner of Motley Fool Money. Patrick Sanders has no position in any of the stocks mentioned. The Motley Fool has positions in and recommends Amazon, Apple, Berkshire Hathaway, Home Depot, Mastercard, and Visa. The Motley Fool recommends UnitedHealth Group. The Motley Fool has a disclosure policy.
People approaching retirement should consider whether delaying benefits is worth the monthly increase.
For 90 years, Social Security has provided millions of Americans with a financial lifeline in retirement, helping to keep many Americans above the poverty line. That’s why deciding when you want to claim benefits is such a crucial decision because it permanently affects how much you’ll be receiving in monthly benefits.
As of the end of 2024, the average monthly benefit for someone aged 70 was $2,148.12, or approximately $25,777 annually. For men, the average benefit at that age is $2,389.95, and for women, it’s $1,909.42 (the difference is due to the disparity in lifetime earnings).
Image source: Getty Images.
How claiming at 70 affects your monthly benefit
For anyone born in 1960 or later, your full retirement age (FRA) is 67. This is the age at which you can receive your full monthly benefit amount, known as your primary insurance amount (PIA). Starting at your PIA, the Social Security Administration calculates your monthly benefit based on whether you claim before or after your FRA.
By delaying benefits past your FRA, you increase your monthly benefit by 2/3 of 1% monthly, or 8% annually. You can delay benefits and receive this increase until you reach age 70; after that, your monthly benefit is no longer increased, so that’s realistically the latest age you should claim benefits.
For example, if your PIA was $2,000 at your FRA (assuming it’s 67), delaying benefits until 70 would increase your monthly amount by 24%, taking it to $2,480. This increase, along with the annual cost-of-living adjustment (COLA), is why the average benefit is higher at 70 than at younger ages.
A 401(k) is a common type of retirement account that employers offer to their workforce.
The 401(k) account is one of the most common retirement savings accounts that employers offer their workers. Employees are able to contribute pre-tax dollars to these accounts and invest them tax-deferred. Only when withdrawals are made do the account holders pay taxes at their ordinary tax rate.
Employers have the option to offer some kind of matching contribution, usually up to a set percentage of each employee’s salary. Employer contributions are deductible up to a certain point.
With everyone making different salaries and employers having different policies for their 401(k) plans, it’s natural for workers to wonder how much they should save as they approach retirement. While there is no single right answer, available data can help you gauge where you stand.
Image source: Getty Images.
The average 401(k) balance for retirees age 60 and older
While several companies provide data on the average 401(k) balance, I like to use Fidelity when I can, given the company’s size and reputation in the space.
At the end of 2024, Fidelity looked at 401(k) data from 26,700 corporate defined contribution plans that included 24.5 million participants. The company found that the average 401(k) balance was $246,500 for ages 60 to 64, $251,400 for ages 65 to 69, and $250,000 for ages 70 and over.
Fidelity actually recommends saving much more than this amount. In prior articles, the company has suggested having eight times your annual salary by age 60 and 10 times your annual salary by age 67. With median annual earnings for a full-time U.S. worker above $50,000, Fidelity’s recommendation is far higher than the approximately $250,000 average balance for its plan participants near retirement.
But again, there’s always a difference between advice and reality. Retirees should also understand that an average number among tens of millions of people captures so many different scenarios. Ultimately, retirees should think about the lifestyle they want in retirement and work with a financial advisor or on their own to determine how much they need to support that lifestyle.
Celebrities are all too familiar with the world of deepfakes, the colloquial term for artificial intelligence-generated videos that depict actors and other Hollywood talent falsely doing or saying things that they never agreed to.
To protect themselves, actors including Steve Harvey, Beverly Hills talent agency WME and studios have enlisted the help of Vermillio, a Chicago-based company that tracks famous people’s digital likenesses and intellectual property online. Depending on what its clients want, it can have the material taken down .
But as AI technology continues to improve and becomes more widely available to the general public, regular people are getting scammed too.
Now, Vermillio says it is offering a version of its service for free to everyone.
The move comes as more and more convincing deepfakes continue to proliferate online, making it difficult for social media sites to police such activity. In 2019, there were about 18,000 deepfakes globally and this year, there have been roughly 2 trillion generative creations, said Vermillio Chief Executive and co-founder Dan Neely.
That leaves average Joes at a growing risk of being impersonated online, with little recourse.
“We can’t wait for governments to solve this problem,” Neely said. “We can’t wait for legislators to solve this problem. We can’t wait for other people to solve this problem. We just said it’s the right thing to do, so we should just be doing it.”
With this move, Vermillo is adopting a classic “freemium” model — offering partial service for no charge and up-selling for additional features.
Here’s how it works.
Using its TraceID technology, the company flags problematic content. For paying clients, Vermillio can send take-down requests to sites such as YouTube or Instagram. Additionally, Vermillio says clients can monetize their data by licensing it.
People who sign up for the free version enter information about themselves such as their name, date of birth and social media handles on sites including Instagram or YouTube.
Then, Vermillio will use that information to build a “likeness model” to scour the Internet for potential red flags involving the user’s identity. Then Vermillio alerts the user to what exists online. For example, if someone has created a fake Instagram account of that user, Vermillio would flag that.
Users are notified of this type of content and can decide for themselves what they would like to allow, or take action to remove. If the user wants Vermillio to request take-downs of the inappropriate content, users would need to upgrade to a paid account, which starts at $10 a month and includes five monthly take down requests.
While many social media platforms give an option to users to flag problematic content, Vermillio said it is faster and more effective than having users go directly to YouTube or Instagram to rectify the situation. It has built a network of partners and can escalate take-downs in as quickly as an hour, the company said.
Vermillio executives said some real life examples of deep fakes include celebrity voices used to raise money for fake charities or terrorist organizations, and high school students creating fake pornography of their classmates.
“It’s affecting regular people in the sense that they’re getting scammed by deep fakes, but it’s also affecting teenagers, so people need to understand where they stand,” said Kathleen Grace, Vermillio’s chief strategy officer. “This is an easy way for them to do that.”
While fake social media profiles have existed for years, “generative AI just poured gasoline on it,” Grace said.
The company said hundreds of people use Vermillio’s services, but didn’t specify numbers. By the end of the year, the company expects to have thousands.
Neely said the company isn’t profitable and declined to share revenue figures. Time magazine reported that revenue from Vermillio’s TraceID has increased tenfold from April 2023 to April 2024. The company makes money through the paid versions of its service and licensing. Vermillio has raised $24 million in funding.
Hollywood companies and talent are navigating artificial intelligence in different ways.
Groups such as performers guild SAG-AFTRA are pushing for more state and federal protections against deepfakes. Some celebrities such as Academy Award-winning supporting actor Jamie Lee Curtis struggled to get a fake ad of her on Instagram taken down showing her falsely endorsing a dental product.
WME announced a partnership with Vermillio last year.
“The scale of the issue is extraordinary, so if you’re a rights holder, just trying to understand how much of these AI outputs are based on or utilized my data, my IP in some way, shape or form, is a massive need,” said Chris Jacquemin, WME’s head of digital strategy.
“They’ve obviously proven that TraceID can protect the most important, most high profile public figures in the world,” Jacquemin added. “Opening it up in a much broader application, I think is a huge step forward in really democratizing how anybody can start to police use of their likeness with respect to AI and AI platforms.”
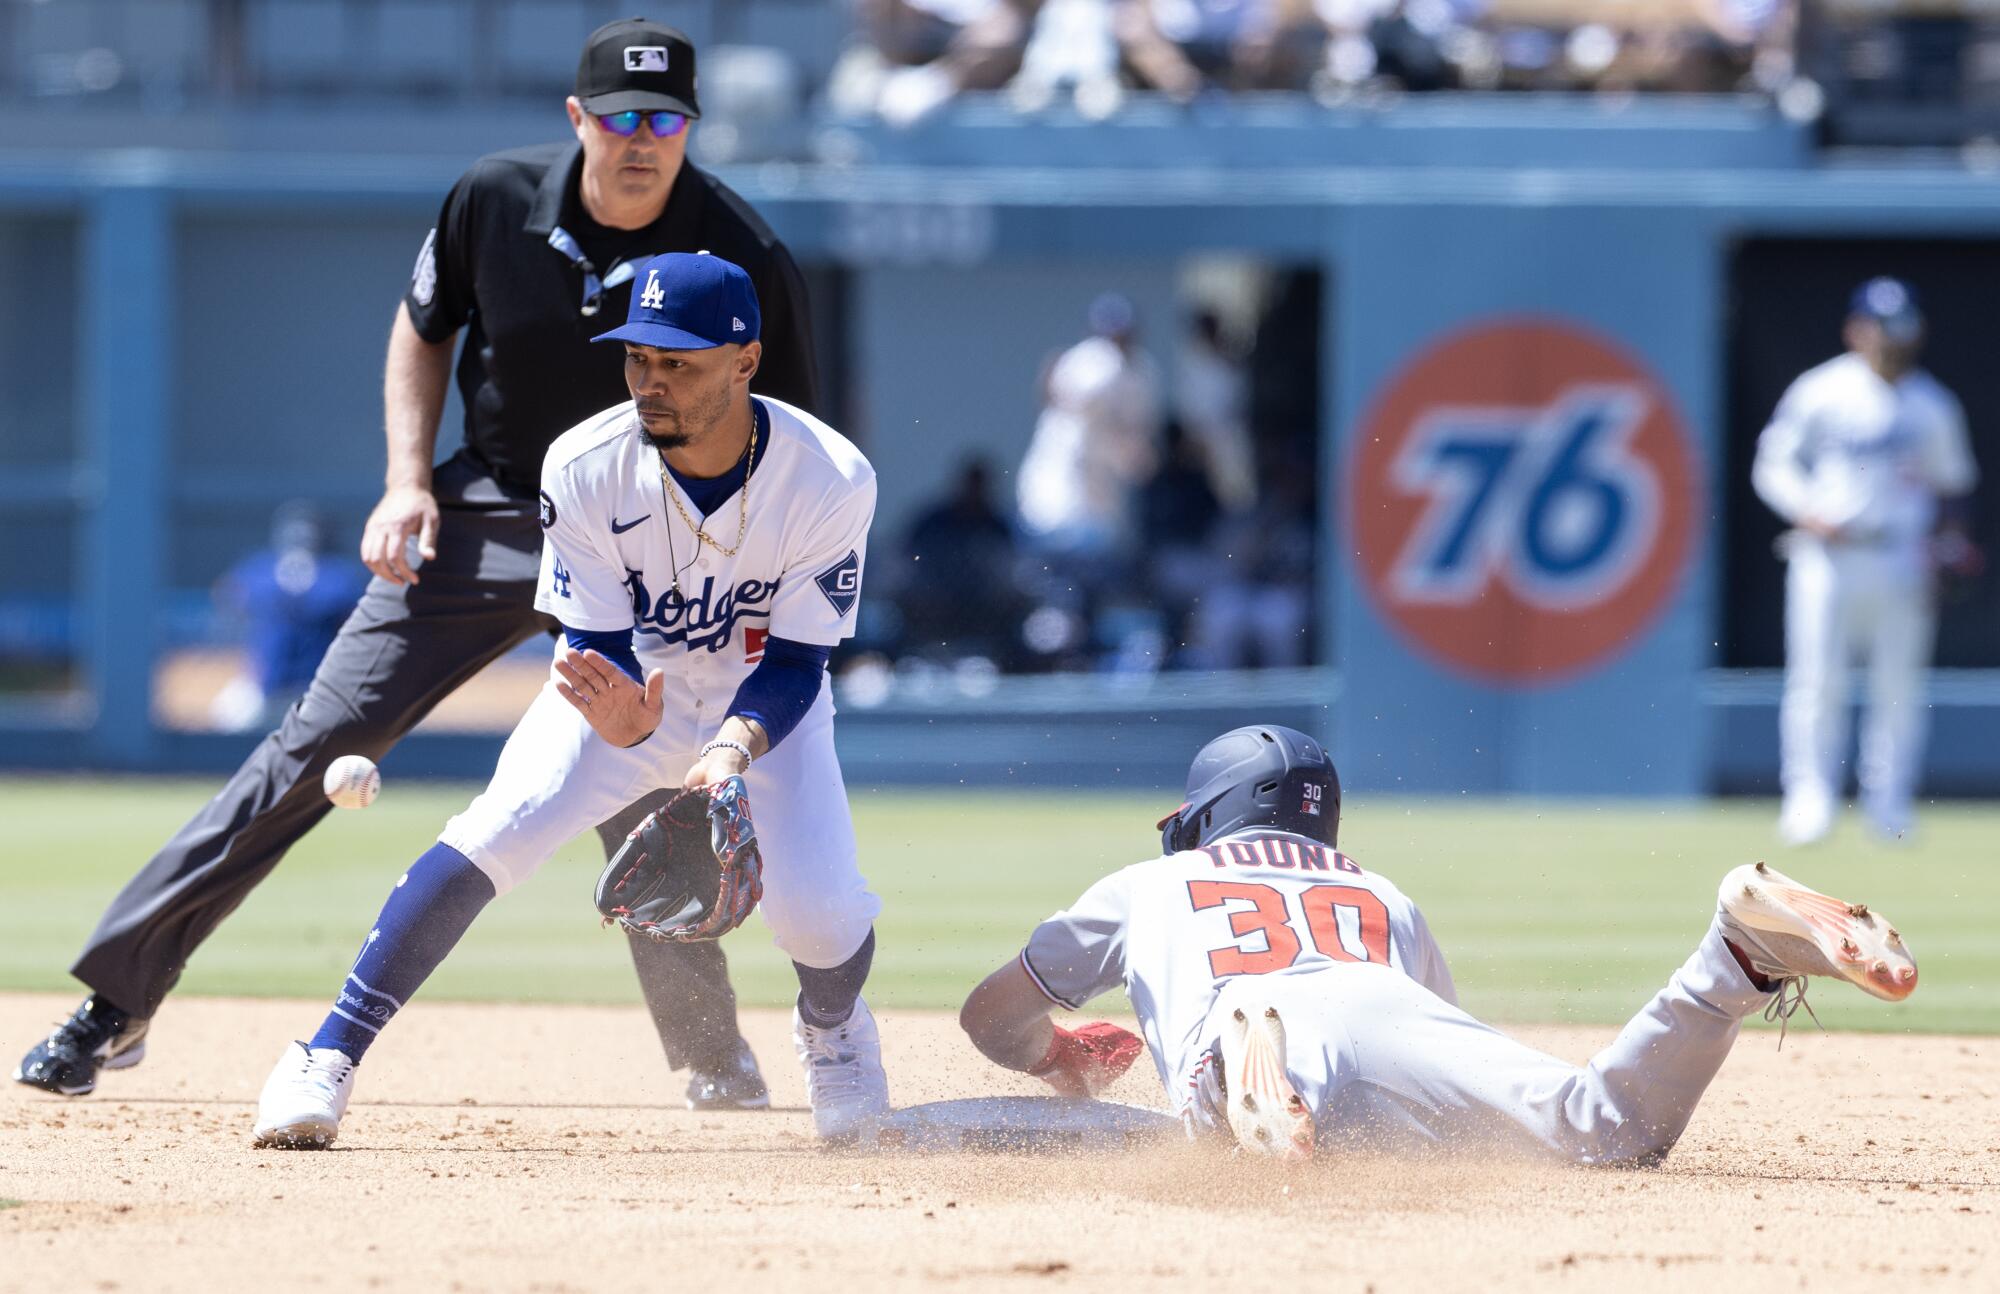
DENVER — As the Dodgers completed a sweep of the Colorado Rockies on Thursday, it was two of their cornerstone hitters who helped lead the way.
In what was then a tie game in the top of the sixth inning, Mookie Betts led off with a double in the gap, Freddie Freeman brought him home with a line drive to right, and the Dodgers took a lead they wouldn’t relinquish, completing a three-game sweep that kept them tied for the best record in baseball.
For much of the last four years, that would’ve been an unremarkable sequence. Shohei Ohtani might be the most potent hitter in the Dodgers’ lineup, but Betts and Freeman have long been the bedrock of their offense; All-Stars in each season they’ve played in Los Angeles, and MVP candidates more often than not.
On Thursday, however, their sixth-inning heroics had a different feel. Because, for the last three weeks, both superstars have been mired in startlingly stark slumps.
Over Betts’ last 17 games, the former MVP is batting .191 with only one home run and eight RBIs — dropping his season-long production to just a shade above league average (he has a 106 OPS+, an all-encompassing stat in which 100 is considered league average).
Freeman’s last 20 games have been even worse, highlighted by a .160 average that marks the lowest of any single-season, 20-game stretch in his entire career — diminishing the stellar numbers he had this year beforehand.
Such coinciding struggles haven’t triggered any “long-term concerns,” manager Dave Roberts said this week. Thursday’s game provided some long-awaited production, a sigh of relief for two veteran sluggers who don’t often need one.
But still, the numbers are the numbers. A trip to even hitter-friendly Coors Field failed to fully bring them back to life. And until they rebound, external questions about their bats will linger, while their personal search for answers will carry on.
“I’ve been frustrated for about six weeks now,” Freeman said recently.
“If I knew [what was wrong],” Betts echoed this week, “I promise you I wouldn’t keep doing it.”
The Dodgers’ Mookie Betts remains adamant that playing shortstop is not the reason his numbers are down at the plate this season.
(Luke Johnson / Los Angeles Times)
It wasn’t long ago that both Betts and Freeman were on polar opposite trajectories, surging through most of May and early June on offensive heaters that evaporated their slow (and physically hampered) starts to the campaign.
On April 28, Betts was hitting only .230 with an OPS nearly below .700, clearly affected by a stomach virus that drained him over the two weeks leading up to opening day.
Then, in a 32-game stretch from April 29-June 7, his typical levels of production suddenly reappeared. He hit .312 with four doubles, four home runs and an .835 OPS. And he did it all while showing defensive mastery of shortstop, quieting a growing narrative that the toll of his new position was curbing his capabilities at the plate.
“It’s not about shortstop,” Betts said last month. “Because remember, last year, I was playing pretty well [offensively while] playing at shortstop. I had no idea what I was doing. Now, I’m way more confident in how I show up and prepare each and every day. The shortstop argument can’t be it.”
Given his recent skid, however, such speculation is back.
“I’m gonna hold to no,” Roberts said when asked about the dynamic again this week. “I think it’s a fair debate. But all I can go with is what Mookie is saying, as far as the separation of the hitting to the defense, the comfort level with the defense … So I don’t think there’s a correlation.”
Instead, Roberts pointed to a lack of power as a bigger factor. Betts’ .392 slugging percentage thus far is 50 points worse than his previous career-low (which came in his rookie 2014 season). He ranks below league-average in underlying metrics such as exit velocity, hard-hit percentage and bat speed most of all (slipping to the 11th percentile among MLB hitters in that category).
“I think it’s the lack of hitting the ball on the barrel,” Roberts said. “He’s a guy that knows how to find the barrel. But there’s times that he’s chasing a little bit more than he usually does. And then there’s a lot more pop-ups than typical. So to get power, you gotta find the barrel. That’s what we’re trying to do.”
Freeman has endured even more whiplash amid his rollercoaster season.
At the end of May, he was leading the National League with a .374 batting average. He was seemingly compensating for whatever lingering pain remained in the right ankle he had surgically repaired in the offseason, then re-aggravated with a slip in the shower at the end of March.
Even at age 35, he appeared primed for a potential career season, well on track for an elusive first batting title.
“He’s just been relentless,” Roberts said last month.
Now, however, one of the game’s best hit collectors can’t seem to buy a knock most days. His batting average has fallen all the way to .309 entering Friday. Before his Thursday afternoon single, he was 0-for-11 in the Rockies series and one-for-his-last-22 overall.
“I have seen some signs where he’s hit some balls hard and hasn’t gotten anything to show for it,” Roberts said, searching for positives amid Freeman’s highly uncharacteristic slump. “That’s discouraging for him. But I just know he’s gonna find his way out of it.”
To this point, though, he hasn’t, with his usual routine of slump-busting drills — from a net exercise designed to promote an inside-out bat path, to mental cues intended to help him stay back in his swing — having yet to get his mechanics re-aligned.
“I’ve gone through every cue 16 times over again in the last six weeks,” he said. “So just waiting for it to click.”
Though Freeman, who also battled a minor quadriceps injury in recent weeks, still looks hobbled while running the bases and playing defense at times, he insisted the problems aren’t injury-related.
“The only pain is the swing,” he said.
And despite his best efforts to conceal such frustrations during games, Roberts has noticed the toll his slump has started to take.
“I think he just wants consistency from his swing,” Roberts said. “Wants to feel right consistently.”
Somewhat amazingly, the Dodgers haven’t missed a beat even with their superstar pairing clearly out of tune. The team is 13-4 in its last 17 games. The offense has scored six runs per game in that span, half-a-run better than its already MLB-leading season average. Other middle-of-the-order bats — from current NL batting leader Will Smith, to June player of the month candidate Max Muncy and rising second-year star Andy Pages — have helped pick up the slack.
But in the long run, much of the Dodgers’ success still figures to run through Betts and Freeman. They are still the two most veteran, experienced producers in a lineup full of All-Star caliber talent.
At the very least, Roberts insisted, Thursday offered “something to build on.”
But with the way the last month has gone for each, there remains a lot of work left to do.
WASHINGTON — Americans’ per capita income–after adjustment for inflation–declined in 1991, the first drop in nine years, the Commerce Department reported Wednesday.
The fall in real personal income was even greater in California, reflecting the impact of the recession in the state.
Nationwide, personal income averaged $19,082 last year, a scant 2.1% improvement over the prior year. That compares to a 4.1% rise in consumer prices, meaning real per capita income fell last year.
In California, personal income averaged $20,952 in 1991, a 1.3% increase over 1990. Nevada lagged even more with personal income of $19,175, only 0.7% higher than the prior year.
It was the first time since 1982 that growth in per capita income failed to keep pace with inflation, and it was the slowest growth since per capita incomes rose just 1% in 1958, a recession year.
The Commerce Department calculates personal income using wages and salaries, rents, dividends and government payments such as Social Security. This total measure of income–$4.81 trillion nationally in 1991–divided by a population of 252.2 million yields the per capita income for America.
California last year was among a group of 14 slow-growing states, according to the Commerce Department. This represents a major change from the 1980s, when these states were enjoying rapid growth, significantly above the national expansion of per capita incomes. They led the boom, with the central part of the nation lagging behind.
Now the situation is reversed, with the Midwest enjoying growth while both coasts suffer from sluggish economic performance.
The eastern states, notably New England and New York, suffered “declines in earnings in construction, durables, manufacturing and retail trade,” the Commerce Department said. Incomes grew in the West, but population and inflation grew even faster.
The fast-growing states, in which per capita income outstripped the national average, had strong gains in construction, manufacturing and service industries, the Commerce Department said. This group included Texas, Colorado, Wyoming, Montana, Hawaii and Utah.
Nationally, the growth rate in per capita income has been slowing since the end of the Reagan Administration. The increase in 1988 was 7.1%, and then slipped to 6.9% in 1989, and 5.4% in 1990 before reaching 1.3% last year.
The Commerce Department indicated that the recession, now in its second year, has had widespread and pervasive impact throughout the country. The growth of income slowed in all 50 states compared to the previous year’s performance.
“The defense cutbacks are having a big impact,” said Rudolph E. DePass, a Commerce Department analyst. “The high-income states (in the 1980s) . . . were generally all pretty heavily involved in the defense industry.”
Only seven states enjoyed per capita incomes in 1991 matching or exceeding the national inflation rate. They were: Wyoming, 5.1%; Montana, 4.8%; North Dakota, 4.8%; Hawaii, 4.6%; Louisiana, 4.2%; New Mexico, 4.1%, and Arkansas, 4.1%. Mississippi at 4% virtually matched the national average.
Economists predicted that income growth would improve modestly this year as the economy recovers.
“1992 will be slightly better. You could see a 3% to 4% increase,” said economist Lawrence Chimerine of DRI-McGraw Hill, a Lexington, Mass., forecasting firm. “But we still will be lucky to match or exceed inflation, and we won’t make up for the weakness of the last several years.”
The NCAA Division I college baseball playoffs begin this week, and there are several graduates from Southern California high schools representing in the college ranks.
Freshman Dylan Volantis of Texas, a Westlake High graduate, has had an All-American season, going 4-1 with a 1.99 ERA and 12 saves as a closer in the SEC.
Freshman shortstop Nate Castellon, a Calabasas grad, helped Cal Poly win the Big West tournament. He’s batting .364.
Collin Clarke (Santa Margarita) is 5-2 with a 4.59 ERA for Oregon. Trent Caraway (JSerra) has 33 RBIs for Oregon State. Colin Yeaman (Saugus) is batting .342 with 13 home runs and 55 RBIs for UC Irvine. Aiden Taurek (Foothill) is batting .336 with 10 home runs and 45 RBIs for St. Mary’s.
Derek Curiel (Orange Lutheran) is the No. 2 hitter for LSU with a .336 average and 45 RBIs. Aidan Cremarosa, who once played for Burbank Burroughs until enrolling at IMG Academy, is 6-5 with a 4.13 ERA for Fresno State.
Dean Curley (Northview) is batting .313 with 12 home runs for Tennessee. Jimmy De Anda (Mater Dei) has a .281 average for Utah Valley.
For USC, Ethan Hedges (Mater Dei) leads the team with a .343 average and has nine saves. For UCLA, freshman Easton Hawk (Granada Hills) has been a late-season closer with five saves.
The Call brothers, Chase and Phoenix, play for UC Irvine and UCLA, respectively, and could face off in the Westwood regional.
This is a daily look at the positive happenings in high school sports. To submit any news, please email [email protected].